Key Takeaways
- Excel's Analysis ToolPak is a free, built-in statistical toolkit that most users never discover
- Activation takes four clicks: File > Options > Add-ins > Analysis ToolPak
- The tool handles descriptive statistics, regression analysis, and moving averages directly in your spreadsheet
When your statistical software license expires mid-thesis, panic sets in. That's exactly what happened to one graduate student who discovered something surprising: the statistical toolkit she needed was already installed on her computer. She just never looked for it.
Microsoft Excel includes a free add-in called Analysis ToolPak that handles most common statistical tasks. It's been bundled with Excel for years, sitting unused in the Add-ins menu while users pay hundreds of dollars for dedicated software like SPSS.
How to Activate Analysis ToolPak
The add-in is disabled by default, which explains why so many Excel users have never seen it. Turning it on takes about 30 seconds.
- Go to File > Options > Add-ins
- Scroll down to Inactive Application Add-ins
- Select Analysis ToolPak
- Click Go
Once activated, the tool appears under Data > Analysis > Data Analysis. It stays available for all future Excel sessions.
Descriptive Statistics: Know Your Data Fast
The first step in any analysis is understanding what your data looks like. In SPSS, you'd run Frequencies or Descriptives. In Excel's Analysis ToolPak, you select Descriptive Statistics, choose your data range, and get a table showing mean, median, standard deviation, standard error, and other common measures.
The graduate student used this for her master's research on an Extensive Reading program. She analyzed survey data for completion time and completion rate. The output showed a mean completion time of 615.92 seconds with a standard deviation of 145.54. This told her most students finished within roughly a 10-minute window.
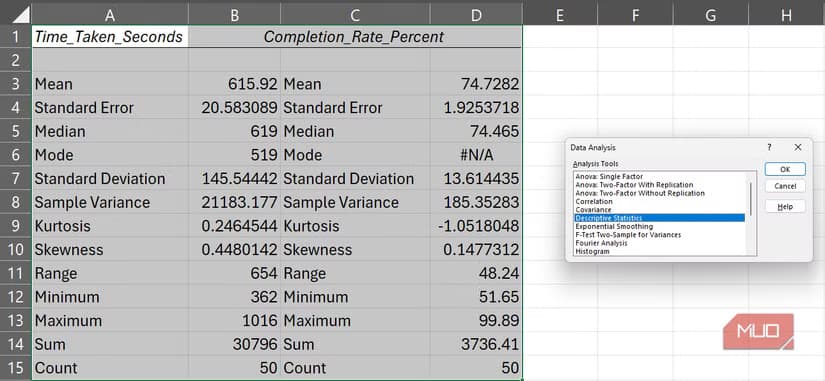
The output appeared directly in the same spreadsheet that held her dataset. No switching between programs. No exporting results. Cross-checking values became simple because everything lived in one place.
Regression Analysis Without the Learning Curve
SPSS regression requires navigating through multiple menus and understanding its particular workflow. Excel's approach is more direct. Select Regression from the Data Analysis dialog, specify your input and output ranges, and the tool generates a summary including coefficients, R-squared values, and significance tests.
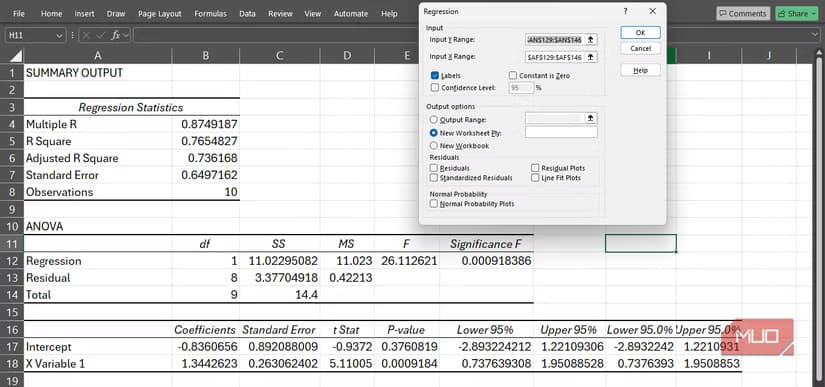
The results appear in a new section of your spreadsheet. You can immediately reference these values in other calculations or charts without any import steps.
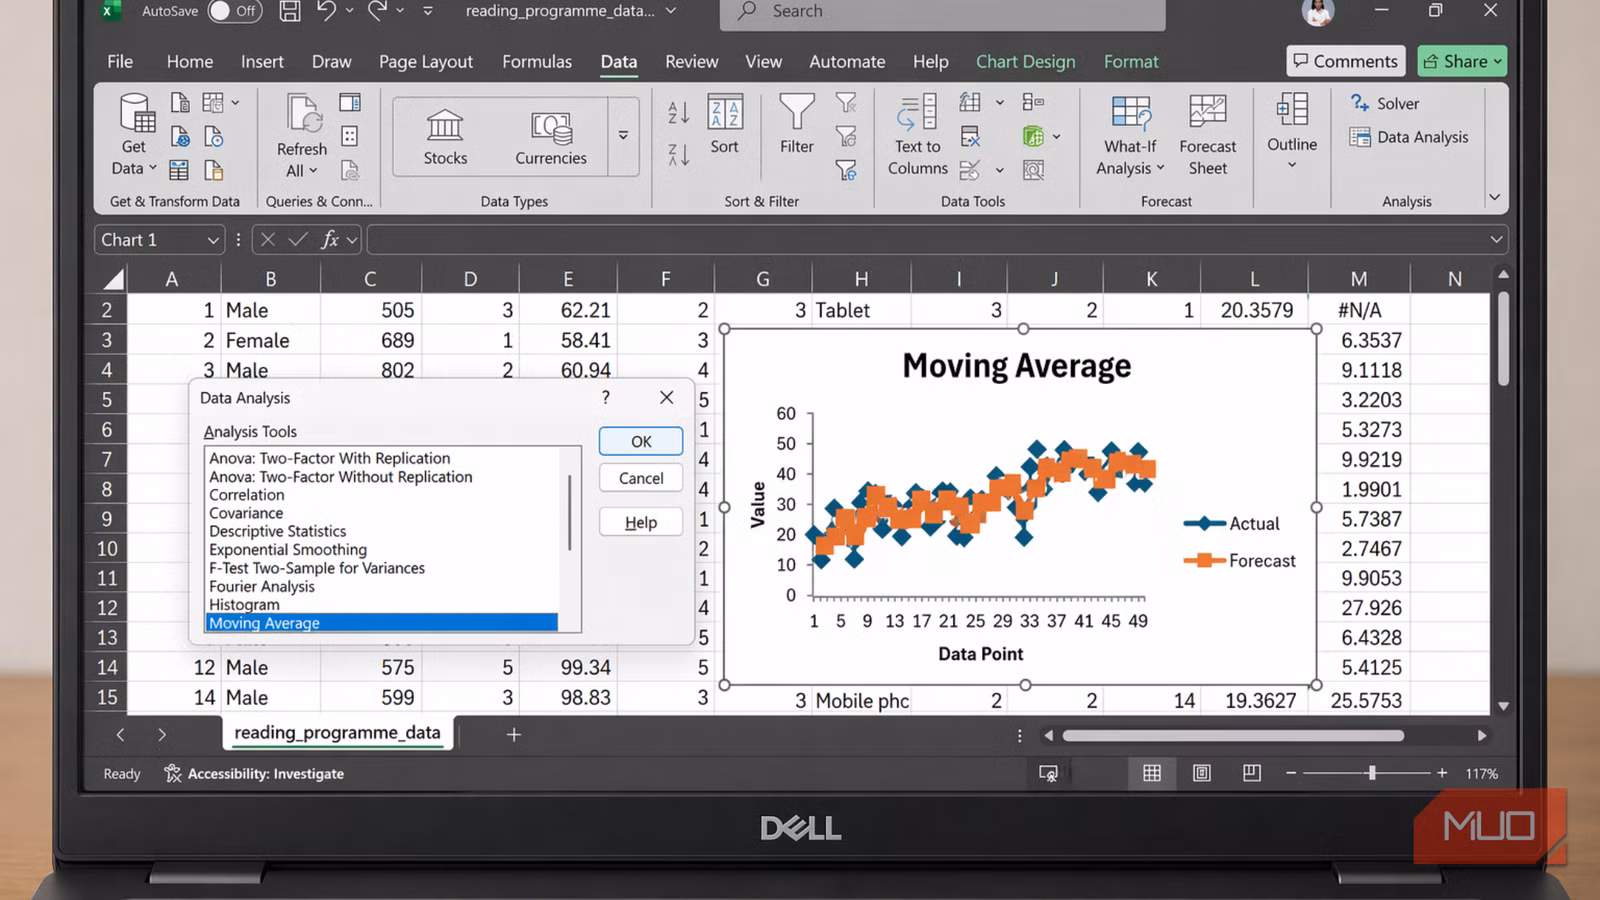
Moving Averages and Forecasting
Beyond basic statistics, the ToolPak includes forecasting tools. Moving averages smooth out fluctuations in time-series data, making trends easier to spot. The tool generates both the calculated values and an optional chart.
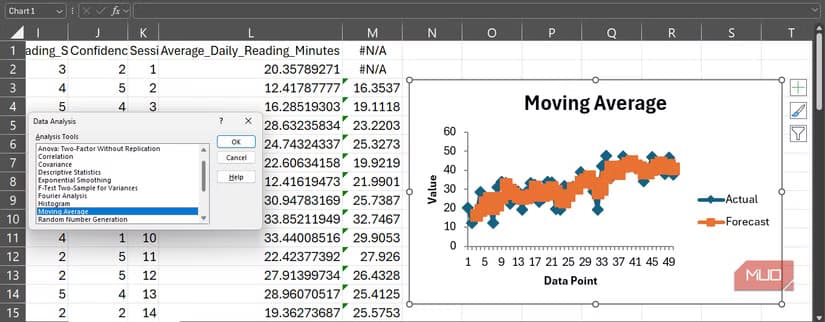
For business analysts tracking sales trends or operations managers monitoring production metrics, this feature provides quick visual insight without specialized software.
Limitations to Consider
The Analysis ToolPak handles data selection in an old-school way. It requires a contiguous reference, meaning your data needs to be in one unbroken block. Scattered data across multiple ranges won't work without reorganizing your spreadsheet first.
The tool also lacks some advanced features that SPSS provides. Complex multivariate analysis, structural equation modeling, and certain specialized tests aren't available. For academic research requiring these methods, dedicated statistical software remains necessary.
But for common business analysis and many research tasks, the ToolPak covers the essentials. Descriptive statistics, t-tests, ANOVA, correlation, regression, and basic forecasting handle a wide range of analytical needs.
Logicity's Take
Another look at replacing paid software with free alternatives
Frequently Asked Questions
Is Excel Analysis ToolPak free?
Yes. It's included with all versions of Microsoft Excel that support add-ins. There's no additional cost beyond your existing Excel license.
Can Analysis ToolPak replace SPSS completely?
For basic statistical tasks like descriptive statistics, regression, t-tests, and ANOVA, yes. For advanced methods like structural equation modeling or complex multivariate analysis, you'll still need dedicated software.
Why is Analysis ToolPak not showing in my Excel?
The add-in is disabled by default. Go to File > Options > Add-ins, find Analysis ToolPak in Inactive Application Add-ins, select it, and click Go to activate.
Does Analysis ToolPak work on Mac Excel?
Yes, but the activation steps differ slightly. On Mac, go to Tools > Excel Add-ins and check the Analysis ToolPak box.
What statistical tests does Analysis ToolPak include?
The tool includes descriptive statistics, t-tests (paired and independent), ANOVA (one-way and two-way), correlation, regression, moving averages, exponential smoothing, histogram generation, and random number generation.
Need Help Implementing This?
Source: MakeUseOf
Manaal Khan
Tech & Innovation Writer
Produced with AI assistance and reviewed by the Logicity editorial team. Learn more in our Editorial Policy.