Why Excel Slicers Beat Standard Filters for Data Analysis
Key Takeaways
- Standard Excel filters hide your active criteria inside menus, making spreadsheets hard to audit
- Slicers create visual control panels where you can see all filtering choices at once
- Traditional filters still work better for columns with hundreds of unique values like part numbers or names
The problem with standard Excel filters
We've all been there. You click the tiny downward arrow at the top of a column, uncheck "Select All," scroll through a long list to find the items you care about, and click OK. It works. But it's clunky.
The real issue shows up the moment you click away. Your filtering choices disappear from view. Unless you reopen the menu, you're left guessing what criteria are currently applied to your data.
The problem gets worse when you layer filters across multiple columns. Filter by country, then department, then product. Suddenly your spreadsheet is dotted with small funnel icons that are easy to misinterpret. Anyone reviewing your work has to click through each filter to understand what they're looking at.
When standard filters still make sense
Traditional drop-down filters aren't useless. They excel in one specific scenario: columns with hundreds of unique entries.
If you're working with specific part numbers, employee names, or transaction IDs, the built-in search box is often the quickest path. Type a keyword, find the exact match, done. Trying to create a slicer for 500 unique part numbers would create an unwieldy visual mess.
The key distinction is this: filters are best for granular, text-based searches. Slicers are best for toggling between broad categories.
What slicers do differently
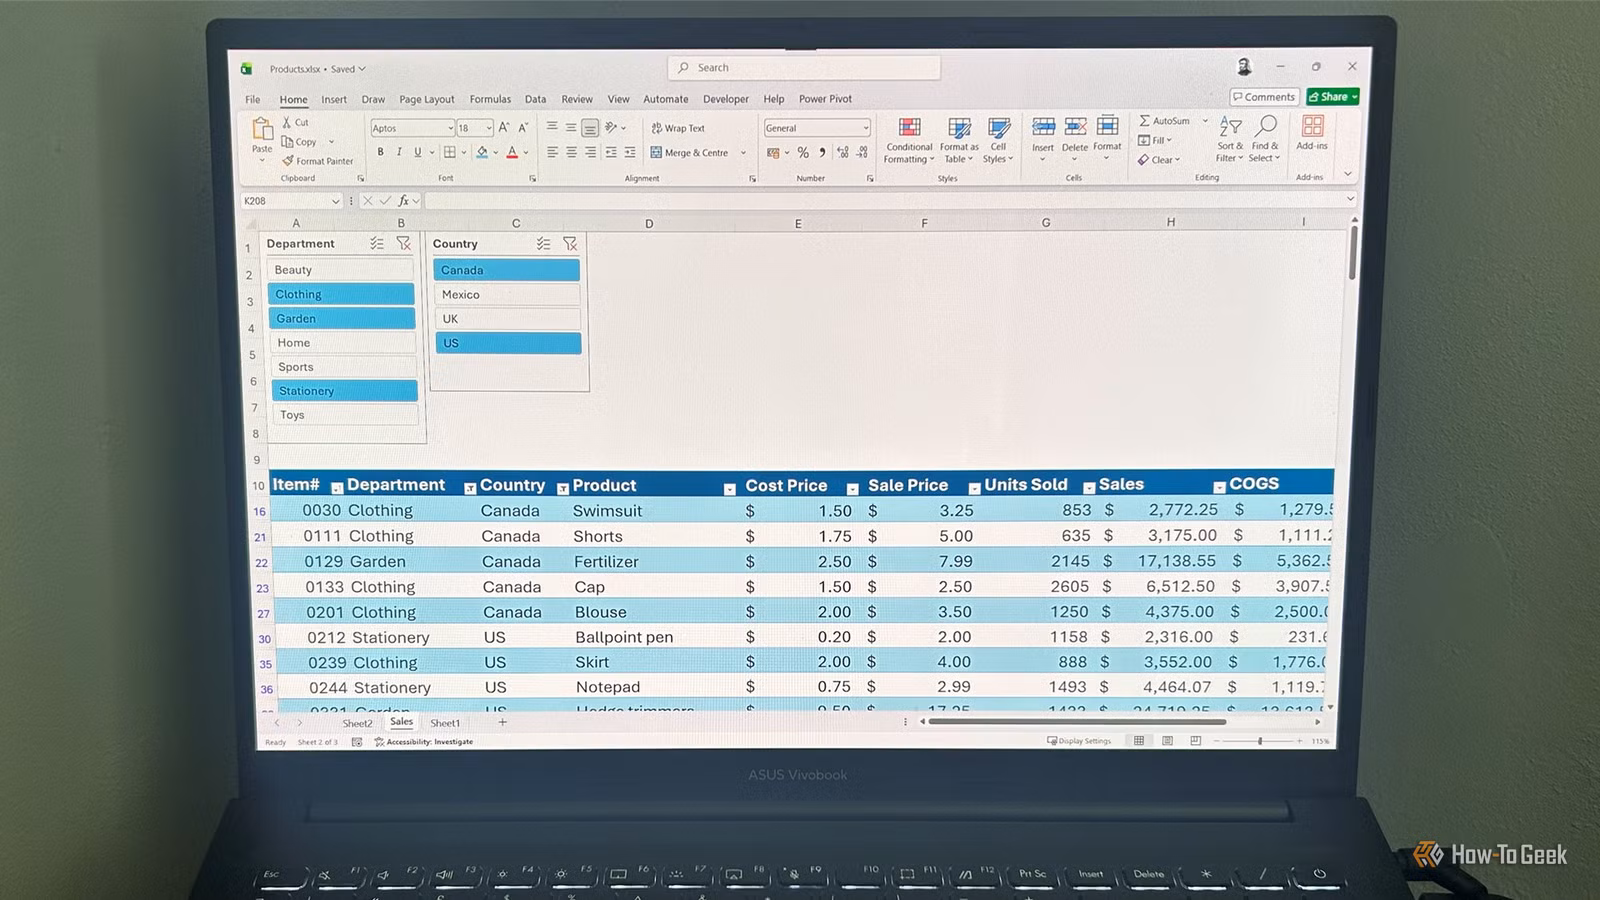
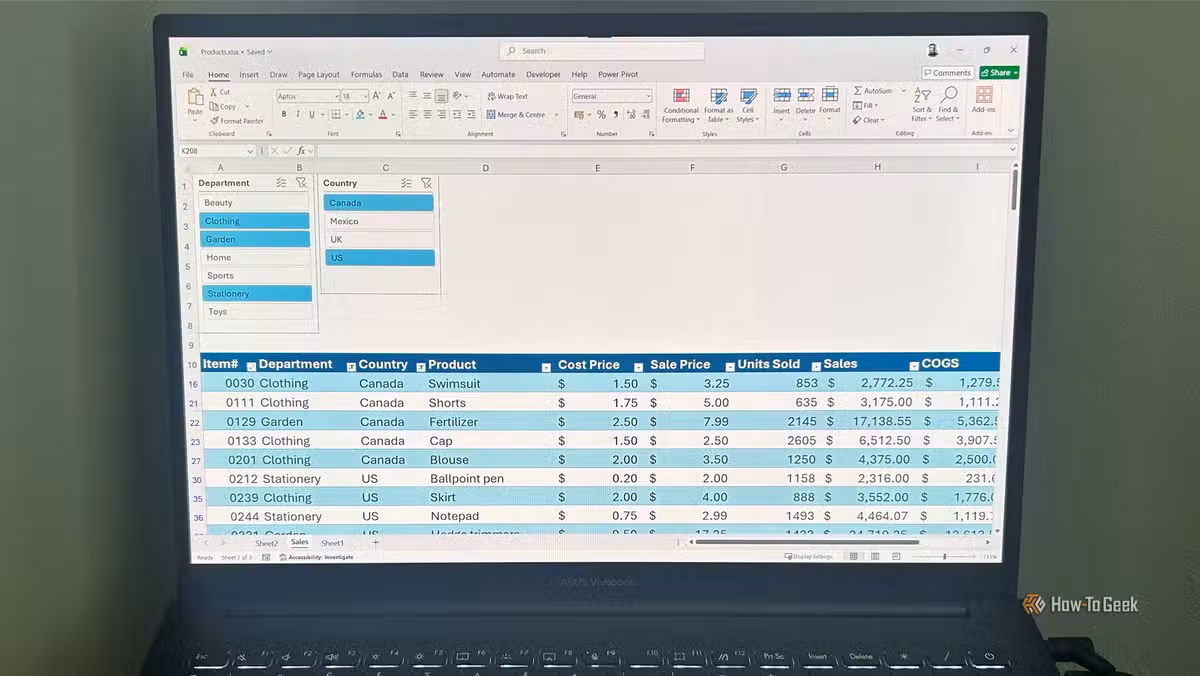
Slicers create floating visual panels that sit above your data. Each button in the panel represents a filter option. Click a button, and that criterion applies immediately. The active selections stay visible at all times.
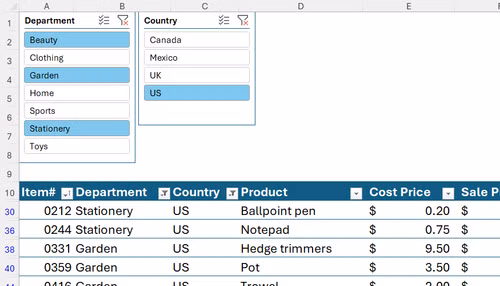
This changes how you interact with spreadsheets. Instead of hunting through menus, you scan the slicer panel and see exactly what's filtering your view. Blue highlight on "Q2 2026" and "Marketing"? That's your current filter state, obvious to anyone looking at the screen.
For teams sharing spreadsheets, this visibility matters. A colleague opening your file can understand the current view in seconds. No menu diving required.
Slicers work with PivotTables too
Slicers pair well with PivotTables and their associated charts. Connect a slicer to a PivotTable, and your chart updates live as you click different criteria. This turns static reports into interactive dashboards.
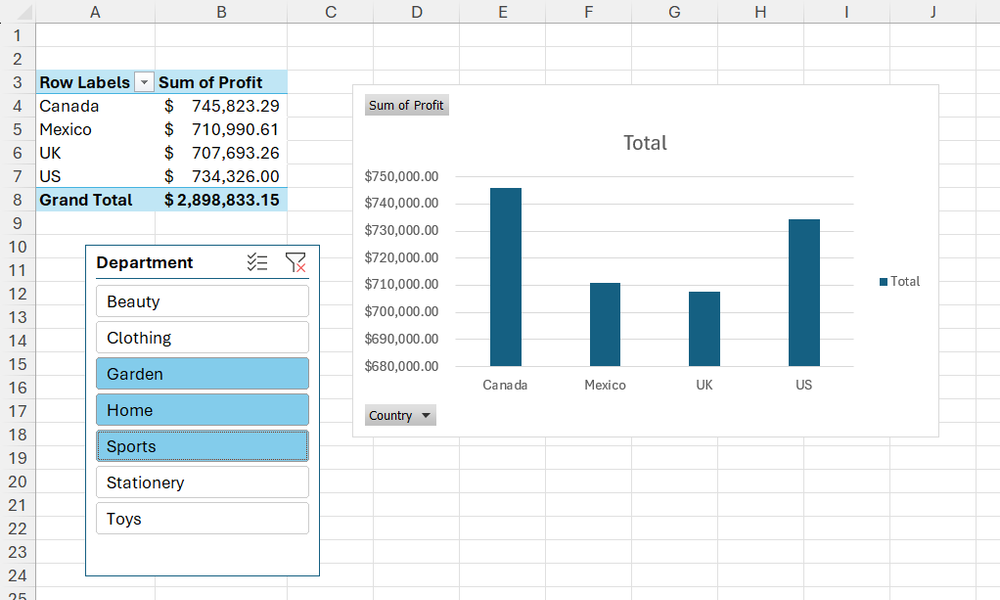
The setup takes a few extra minutes upfront. But the payoff comes during presentations or when exploring data patterns. Click a region, watch the chart shift. Click a product category, see the numbers update. No right-clicking through filter menus while your audience waits.
When to choose each approach
✅ Pros
- • Slicers show active filters at a glance
- • One-click filtering speeds up exploration
- • Easier for colleagues to understand your current view
- • Pairs well with PivotTables and charts for live dashboards
❌ Cons
- • Slicers become unwieldy with hundreds of unique values
- • Take extra setup time compared to default filters
- • Standard filters have a search box for text-based lookups
The decision comes down to your data structure. Categorical columns with a manageable number of options (regions, departments, quarters, product lines) work well as slicers. Columns with many unique text strings work better with traditional filters.
You can also mix both. Use slicers for your high-level category columns and keep standard filters available for the occasional text search in other columns.
Logicity's Take
Slicers solve a real visibility problem in Excel. The shift from hidden menus to visible buttons sounds minor, but it changes how you think about filtering. Instead of applying filters and forgetting what's active, you maintain constant awareness of your data's current state. For anyone who shares spreadsheets with teammates or presents data in meetings, that visibility pays for the extra setup time.
Frequently Asked Questions
Can I use slicers with regular Excel tables, or only PivotTables?
Slicers work with both regular tables and PivotTables. For regular tables, select any cell in the table, go to Insert > Slicer, and choose which columns you want to filter visually.
How many slicers can I add to one spreadsheet?
There's no hard limit. However, adding too many creates visual clutter. Focus on the 2-4 columns you filter most frequently and leave the rest as standard filters.
Do slicers work in Excel Online and mobile apps?
Yes. Slicers created in desktop Excel remain functional in Excel Online and the mobile apps. Users can click or tap slicer buttons to filter data across platforms.
Can multiple slicers control the same PivotTable?
Yes. You can connect several slicers to one PivotTable. Each slicer controls a different field, and all active selections combine to filter your data.
Need Help Implementing This?
Building better spreadsheets and dashboards takes practice. If your team needs help setting up slicers, PivotTables, or other Excel workflows, reach out to the Logicity team. We cover productivity tools, automation, and enterprise software.
Source: How-To Geek
Manaal Khan
Tech & Innovation Writer
Related Articles
Browse all
How to Jailbreak Your Kindle: Escape Amazon's Control Before They Brick Your E-Reader
Amazon is cutting off support for older Kindles starting May 2026, but you don't have to buy a new device. Jailbreaking your Kindle lets you install custom software like KOReader, read ePub files natively, and keep your e-reader alive for years to come.

X-Sense Smoke and CO Detectors at Home Depot: UL-Certified Alarms You Can Actually Trust
X-Sense just made their UL-certified smoke and carbon monoxide detectors available at Home Depot stores nationwide. The lineup includes wireless interconnected models that can link up to 24 units, 10-year sealed batteries, and smart features designed to cut down on those annoying false alarms that make people disable their detectors entirely.
How to Change Your Browser's DNS Settings for Faster, Private Browsing in 2026
Your browser's default DNS settings are probably slowing you down and leaking your browsing history to your ISP. Here's why changing this one setting should be the first thing you do on any new device, and how to pick the right DNS provider for your needs.

Raspberry Pi at 15: Why the King of Single-Board Computers Is Losing Its Crown
After 15 years of dominating the hobbyist computing scene, the Raspberry Pi faces serious competition from cheaper alternatives, supply chain headaches, and a market that's evolved past its original mission. Here's what's happening and what it means for your next project.
Also Read

Netflix June 2026: Avatar Season 2, World Cup Shows, and More
Netflix's June 2026 lineup spans Avatar: The Last Airbender's second season, a $1 million survival competition, and heavy World Cup coverage including a comedy roast of French champions. The month also brings J.Lo's Office Romance and a Chris Evert-Martina Navratilova documentary.

3 Streaming Upgrades That Actually Improve Your Setup
A tech journalist shares three specific streaming upgrades after seven years of Roku use. The Roku Ultra, Bluetooth headphones for late-night viewing, and a soundbar each solve distinct problems without breaking the bank.

Fossify: Free Android Apps That Replace Bloated Defaults
Fossify offers a collection of free, open-source Android apps that replace default phone applications. The suite includes a gallery, music player, calendar, and more. All apps are ad-free, lightweight, and share a consistent design philosophy prioritizing usability.