Key Takeaways
How To Enable Inspect Element In Safari For Macbook Pro/Air
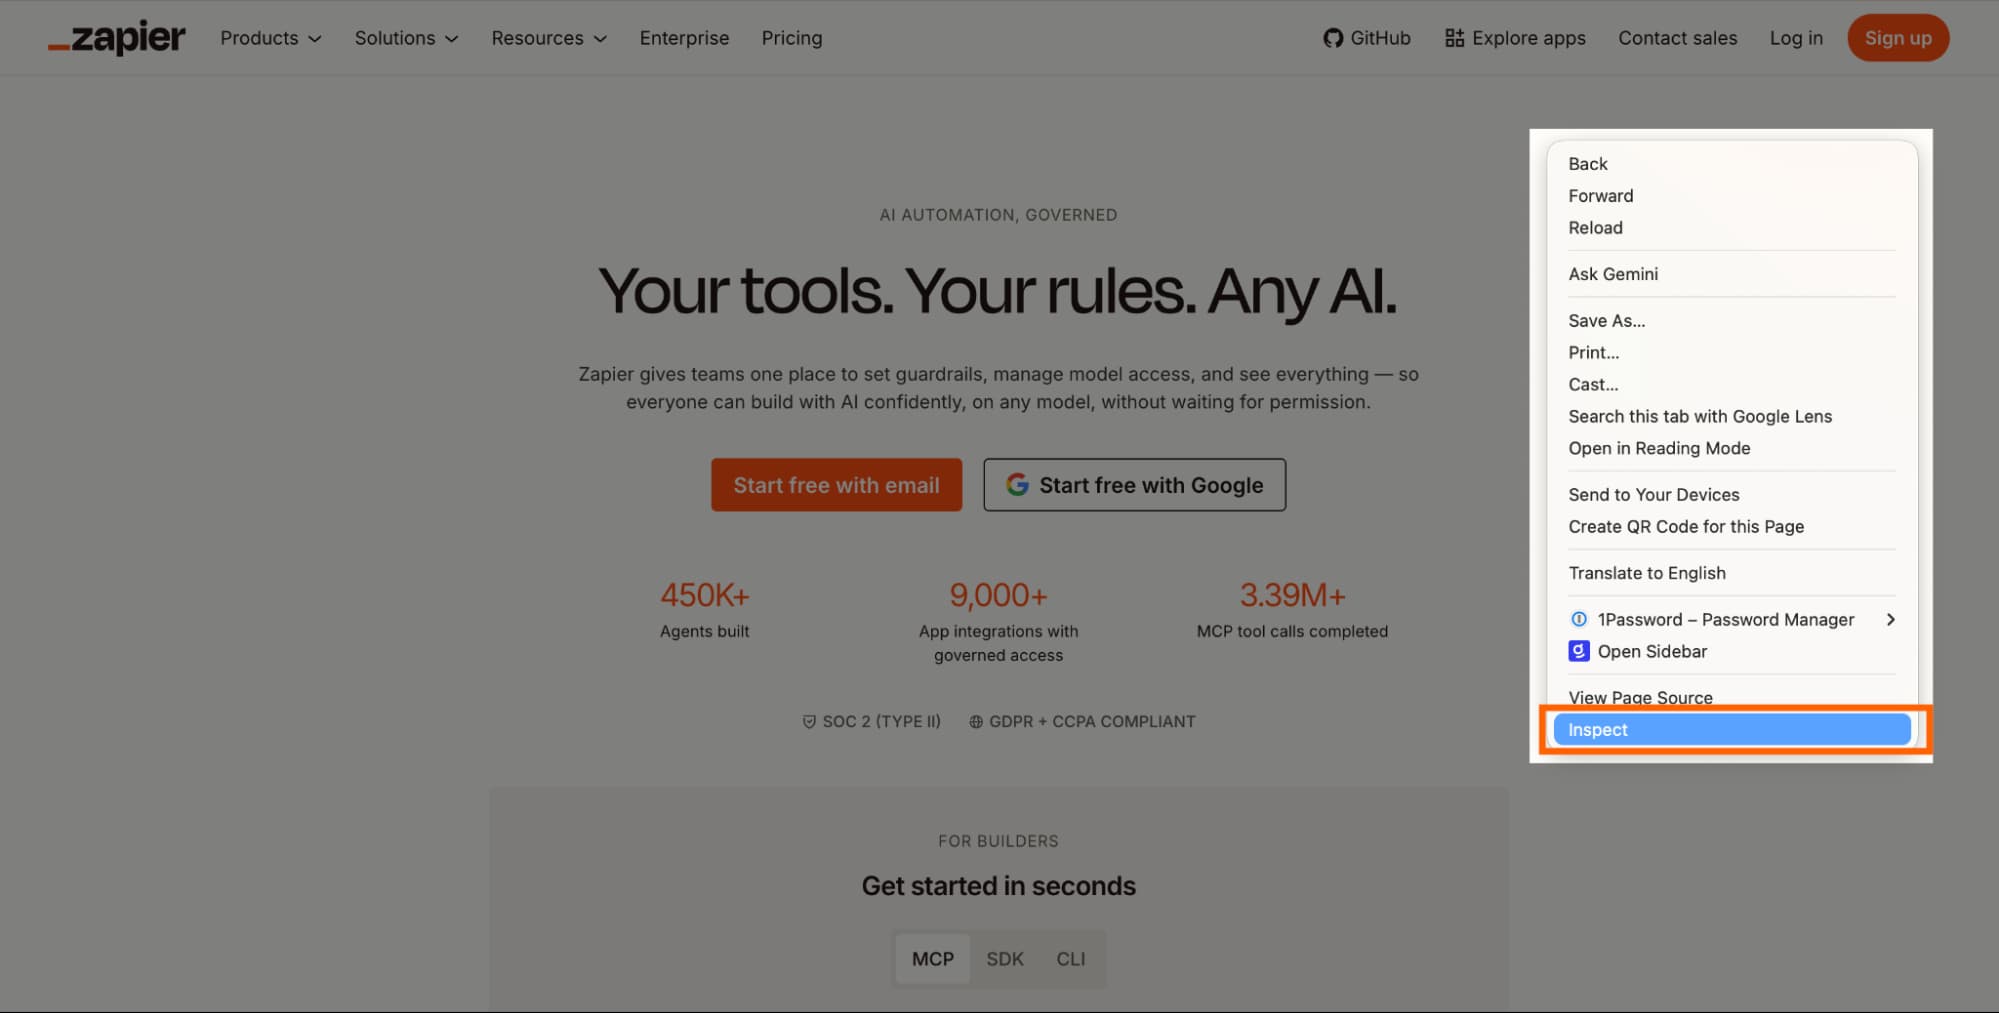
- Right-click any webpage and select Inspect to open developer tools in all major browsers
- Safari requires enabling developer features in Settings > Advanced first
- Edits made in Inspect Element are temporary and reset on page refresh
Every major browser ships a developer tool called Inspect Element. Right-click any page, select Inspect, and you see the live HTML, CSS, and JavaScript behind it. You can edit any of it in real time. Nothing saves. Refresh the page and your changes vanish.
This makes Inspect Element useful well beyond engineering. Marketers can verify tracking pixels. Writers can test how a headline reads in context. Customer support can replicate a user's bug without waiting for a developer. The tool is free, built in, and takes about 30 seconds to learn.
Logicity's Take
For RevOps teams, Inspect Element is an underrated QA tool. Before pushing a form live, you can verify field names match your CRM mapping. You can confirm UTM parameters are firing correctly. And when a landing page breaks, you can diagnose whether it's a CSS conflict or a script error without filing a ticket. Tools like [Zapier](https://logicity.in/r/zapier) or [Make](https://logicity.in/r/make) often rely on accurate HTML selectors. Knowing how to find them yourself saves hours.
Disclosure
Some links in this post are affiliate links — Logicity earns a commission if you sign up, at no extra cost to you. We only link products we have used or actively recommend.
How to open Inspect Element in Chrome
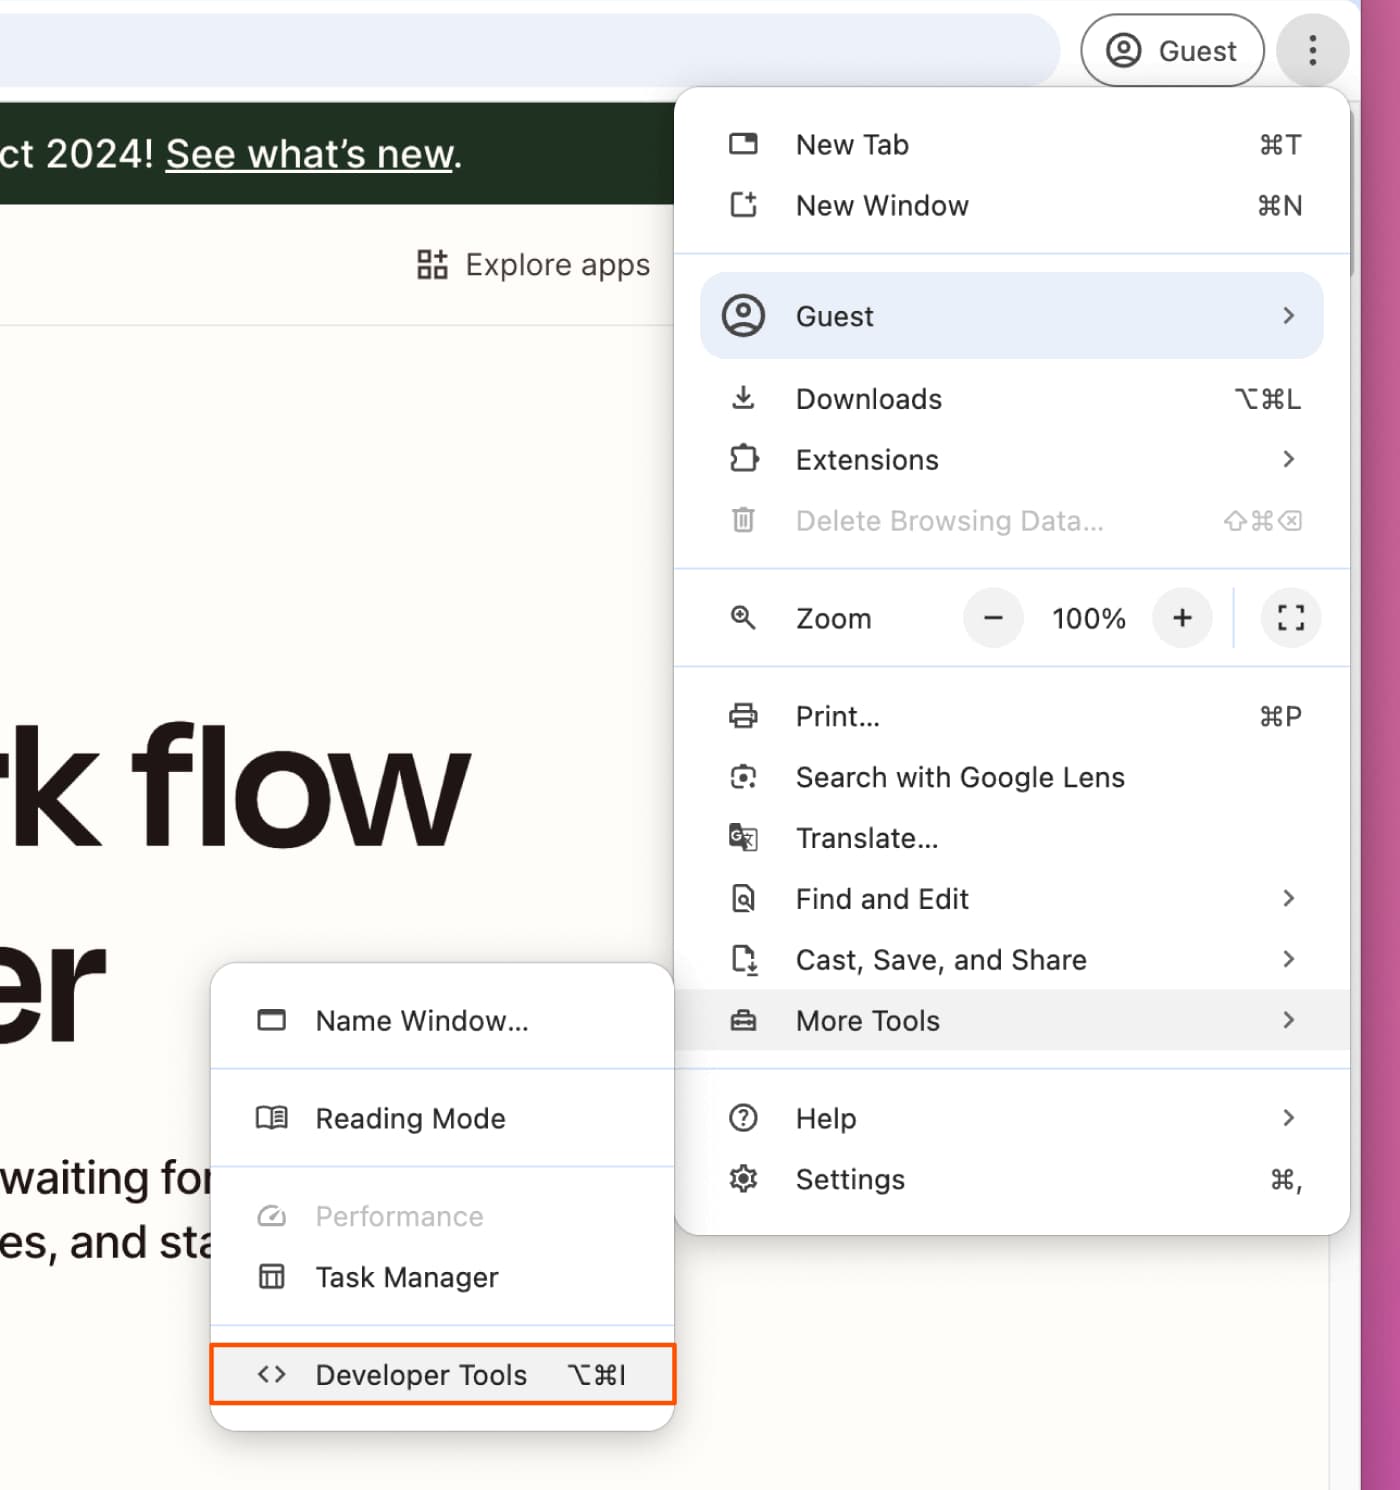
Chrome calls it Developer Tools, or DevTools. The Elements tab is where Inspect Element lives.
- Right-click anywhere on the page and select Inspect at the bottom of the menu.
- Or click the kebab menu (⋮) in the top-right toolbar, select More Tools, then Developer Tools.
- Or use the keyboard shortcut: Cmd + Option + I on Mac, Ctrl + Shift + C on Windows.
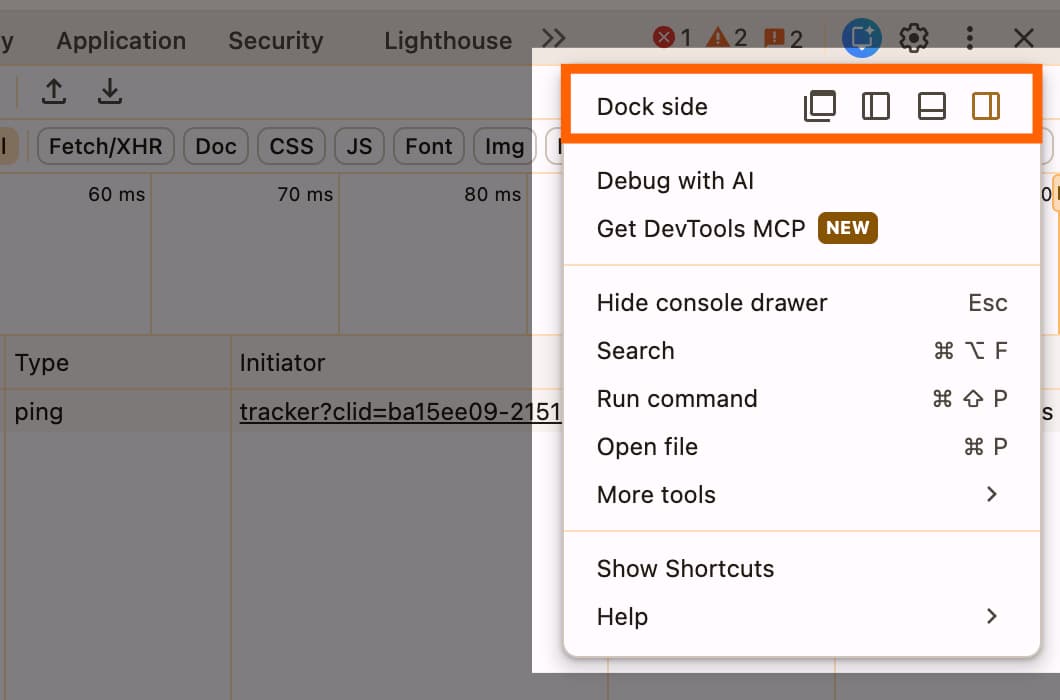
By default, DevTools opens docked to the right side of the window. To move it, click the kebab menu inside DevTools and choose to dock it to the bottom, left, or pop it into a separate window. You can also drag the border to resize it.
How to open Inspect Element in Firefox
Firefox labels its version Web Developer Tools.
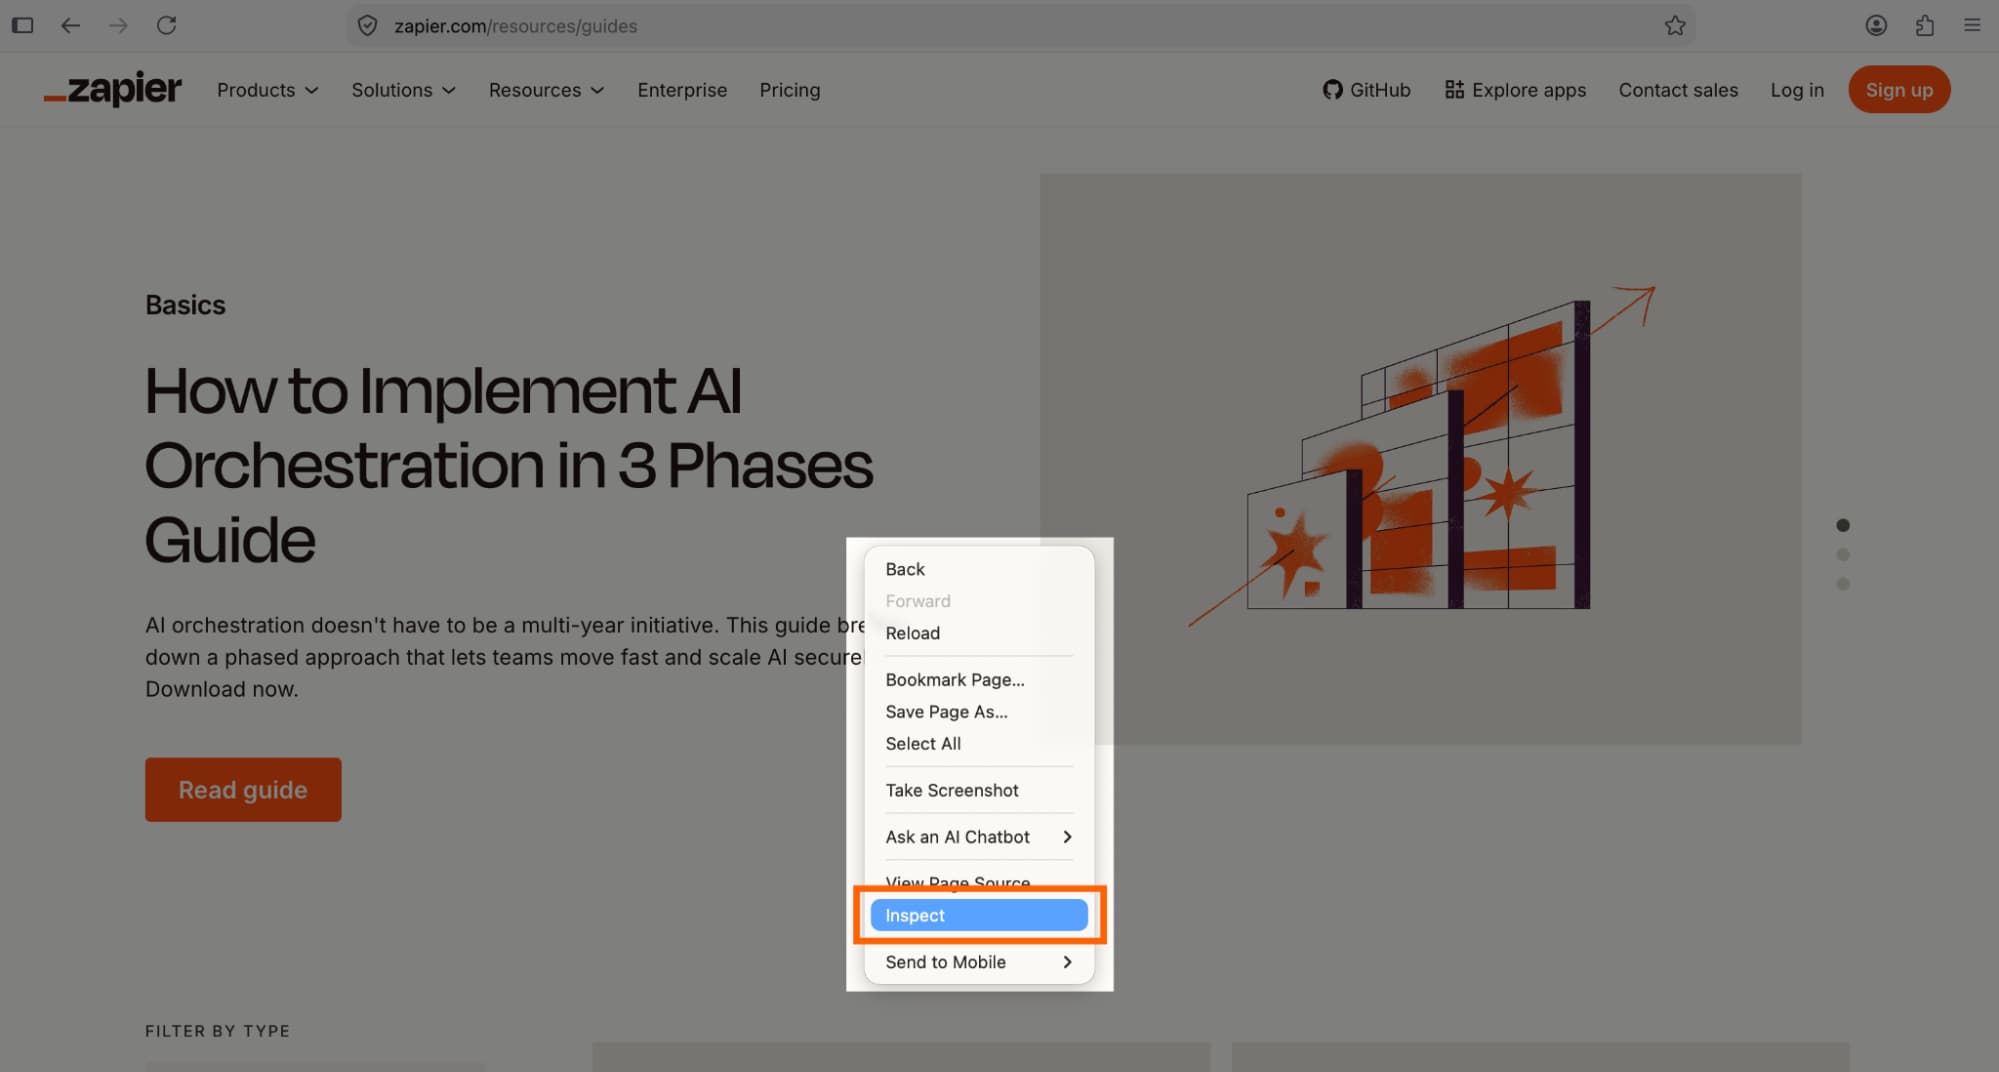
- Right-click anywhere on the page and select Inspect.
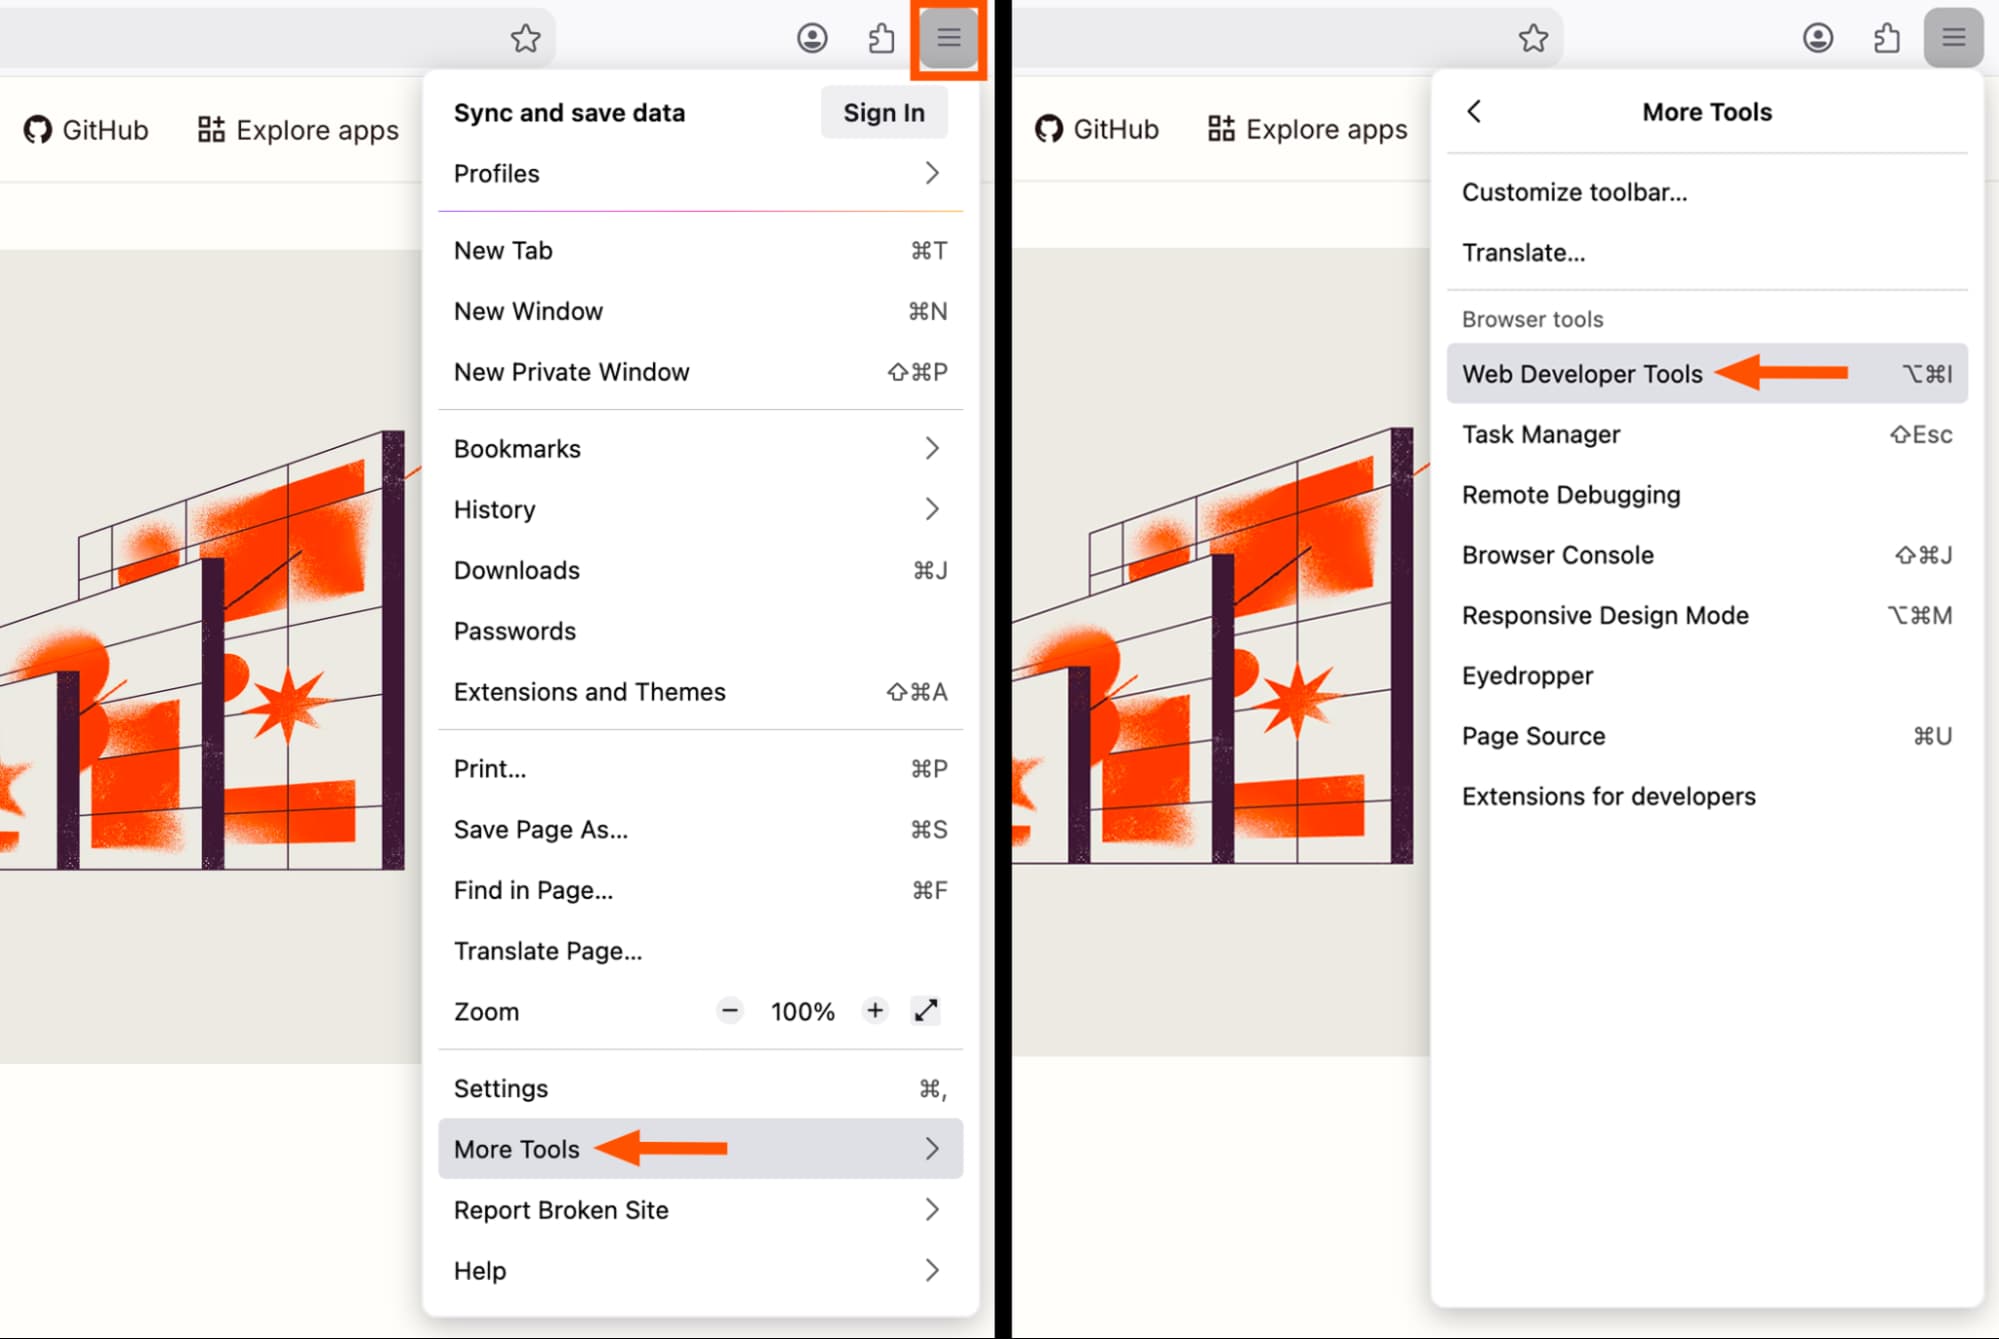
- Or click the hamburger menu (≡) in the top-right corner, select More tools, then Web Developer Tools.
- Or use the keyboard shortcut: Cmd + Option + I on Mac, Ctrl + Shift + C on Windows.
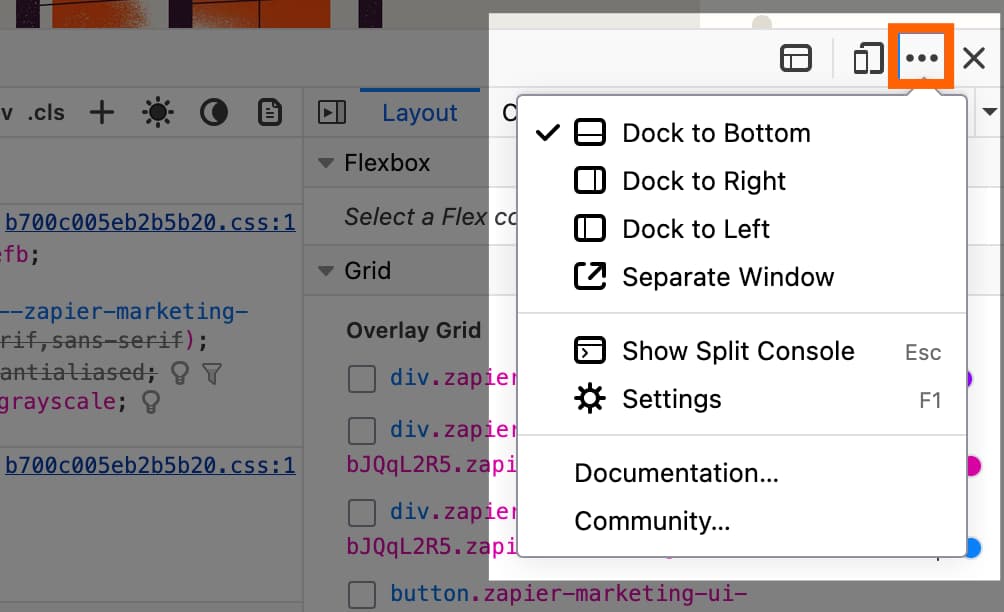
Firefox opens the pane at the bottom by default. To move it, click the three dots near the close button and select a new dock position. You can also drag it into a separate window.
How to open Inspect Element in Safari
Safari hides the option by default. You need to enable it once before it appears.
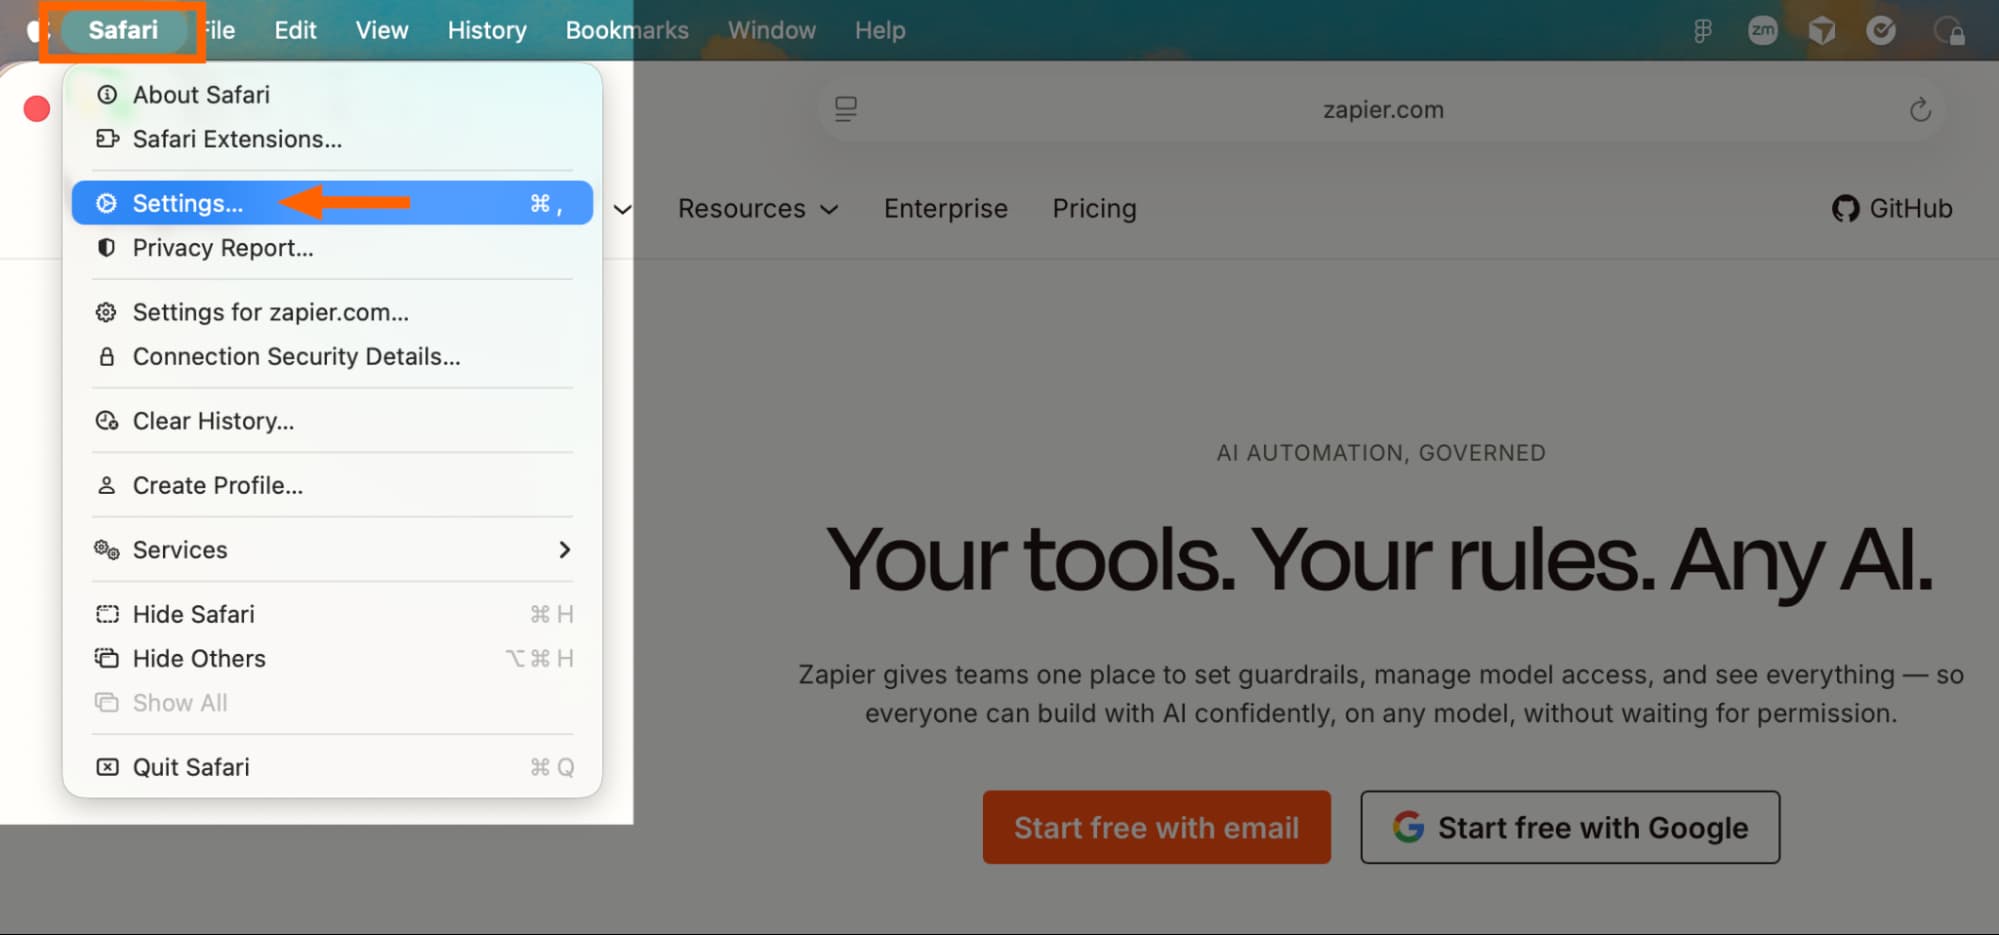
- Click Safari in the menu bar and select Settings (or Preferences on older macOS versions).
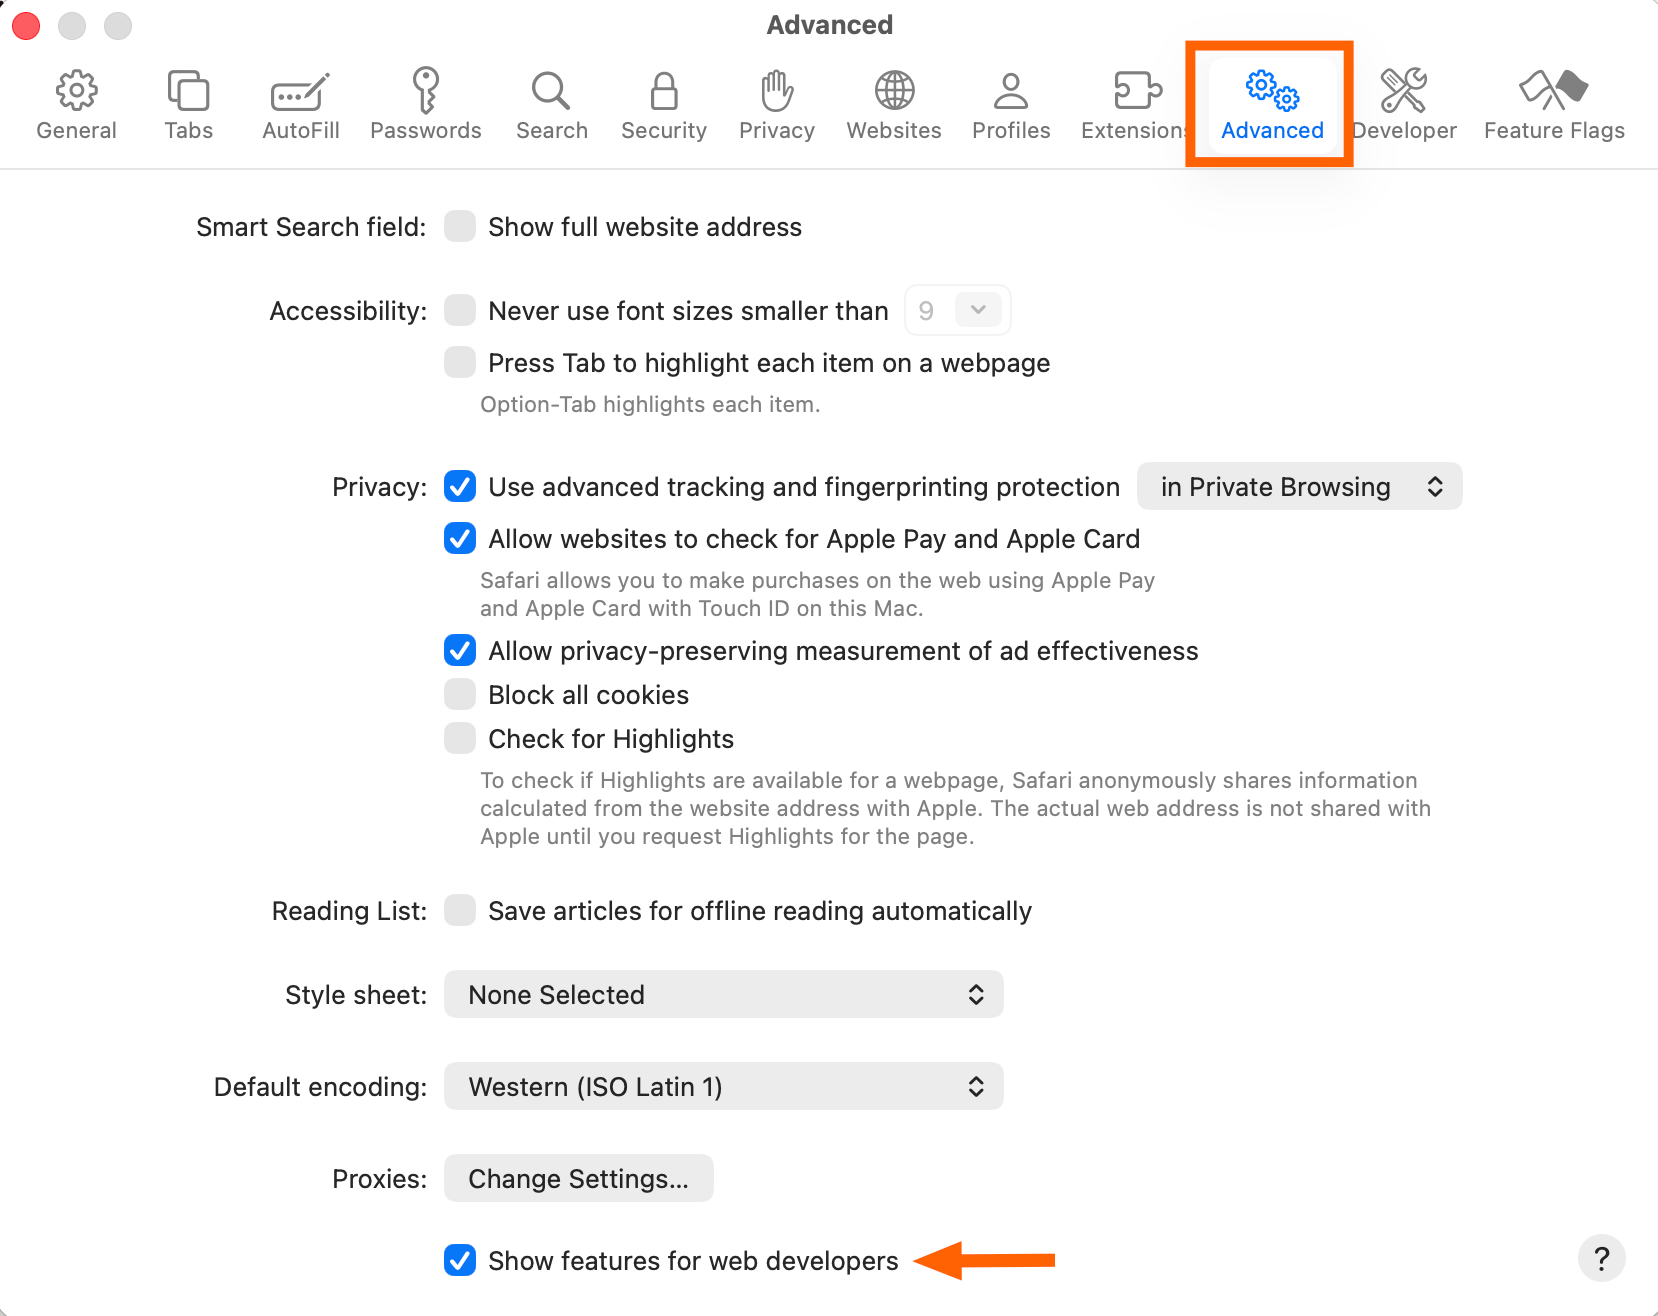
- Click the Advanced tab.
- Check the box next to Show features for web developers, then close the window.
- Right-click anywhere on a page. Inspect Element now appears in the context menu.
Safari opens the pane at the bottom. Click the dock icons in the top-left corner of the pane to move it to the side or detach it.
Keyboard shortcuts for Inspect Element
All three browsers use nearly identical shortcuts. Once you memorize one, you know them all.
| Browser | Mac | Windows |
|---|---|---|
| Chrome | Cmd + Option + I | Ctrl + Shift + C |
| Firefox | Cmd + Option + I | Ctrl + Shift + C |
| Safari | Cmd + Option + I | N/A |
These shortcuts open the full developer pane. If you want to jump straight to selecting a specific element, Chrome and Firefox also support Cmd + Shift + C (Mac) or Ctrl + Shift + C (Windows), which activates the element picker.
What you can do with Inspect Element
The tool does more than show you HTML. Here are the use cases that matter for operations teams.
Search across all files. Chrome's Search feature (open it from the kebab menu inside DevTools) lets you search every file the browser loaded: HTML, CSS, JavaScript, image paths, color hex values, metadata. Firefox and Safari can search too, but only within the currently open tab. Chrome searches globally.
Edit text and images. Double-click any text in the Elements panel to change it. This is useful for testing headline variations or mocking up copy changes before asking a developer to implement them. Changes disappear on refresh.
Test CSS changes. In the Styles pane, you can add, modify, or delete CSS rules. Adjust padding, change colors, swap fonts. The page updates instantly. This is faster than editing a staging environment for small visual tweaks.
Check network requests. The Network tab shows every request the page makes: API calls, scripts, tracking pixels. Filter by type (XHR for API calls, Img for images) to find what you need. This is how you verify that a HubSpot tracking script or Salesforce web-to-lead form is actually firing.
Debug JavaScript errors. The Console tab logs errors and warnings. If a form breaks or a button does nothing, the console usually tells you why. Even if you cannot fix it yourself, you can pass the exact error message to engineering.
If you're customizing browser workflows, you may also want to streamline your OS context menus.
Practical examples for RevOps
Most Inspect Element guides focus on developers. But operations teams can use it daily.
- Verify form field names. Before connecting a form to n8n or your CRM, inspect the form fields to confirm the name attributes match what your automation expects.
- Find CSS selectors for scraping. If you use Zapier's Chrome extension or a web scraper, Inspect Element shows you the exact selector path to the data you need.
- Diagnose broken tracking. Open the Network tab, filter by the tracking domain, and see if the pixel is loading. If it is not, you know the problem is on your site, not in the analytics platform.
- Mock up A/B test variants. Edit headline text or button colors directly in the browser. Screenshot the result. Share it with the team before building it in Webflow or your CMS.
- Scrub sensitive data from screenshots. If you need to share a screenshot but the page contains customer data, edit the text in Inspect Element before capturing.
Frequently Asked Questions
Are changes made in Inspect Element permanent?
No. Everything resets when you refresh the page or close the tab. You are editing a local copy the browser rendered, not the server's files.
Can I use Inspect Element on any website?
Yes. It works on any page your browser can load, including your own sites and third-party pages.
Why can't I find Inspect Element in Safari?
Safari hides developer features by default. Go to Safari > Settings > Advanced and check Show features for web developers.
Can I inspect a mobile site on desktop?
Yes. Chrome DevTools includes a device toolbar (click the phone/tablet icon) that simulates mobile screen sizes and user agents.
Will the website owner know I inspected their page?
No. Inspect Element runs entirely in your browser. No requests are sent to the server.
Need Help Implementing This?
If you're building automations that depend on web selectors or form field names, we can help you set up reliable workflows. Contact us at hello@logicity.in.
Source: The Zapier Blog
Huma Shazia
Senior AI & Tech Writer
Produced with AI assistance and reviewed by the Logicity editorial team. Learn more in our Editorial Policy.