Key Takeaways
- Power Query eliminates 80% of manual data cleanup work in Excel spreadsheets
- Finance teams using Power Query report 15+ hours saved weekly on recurring reports
- Built-in to Excel since 2016—no extra software costs or IT approvals needed
According to [How-To Geek](https://www.howtogeek.com/microsoft-excel-power-query-game-changing-feature-ways-to-put-it-to-work/), Power Query is the most underutilized feature in Microsoft Excel, capable of transforming complex data automation into surprisingly user-friendly workflows that replace fragile nested formulas.
Here's a scenario every operations leader knows: Your team spends the first Monday of each month manually cleaning sales data exports. Someone copies columns, another person fixes formatting, a third runs VLOOKUPs that mysteriously break. By Wednesday, you have a report. By Thursday, someone finds errors.
Power Query eliminates this entire workflow. And it's been sitting in your Excel ribbon since 2016.
What Is Power Query and Why Should CFOs Care?
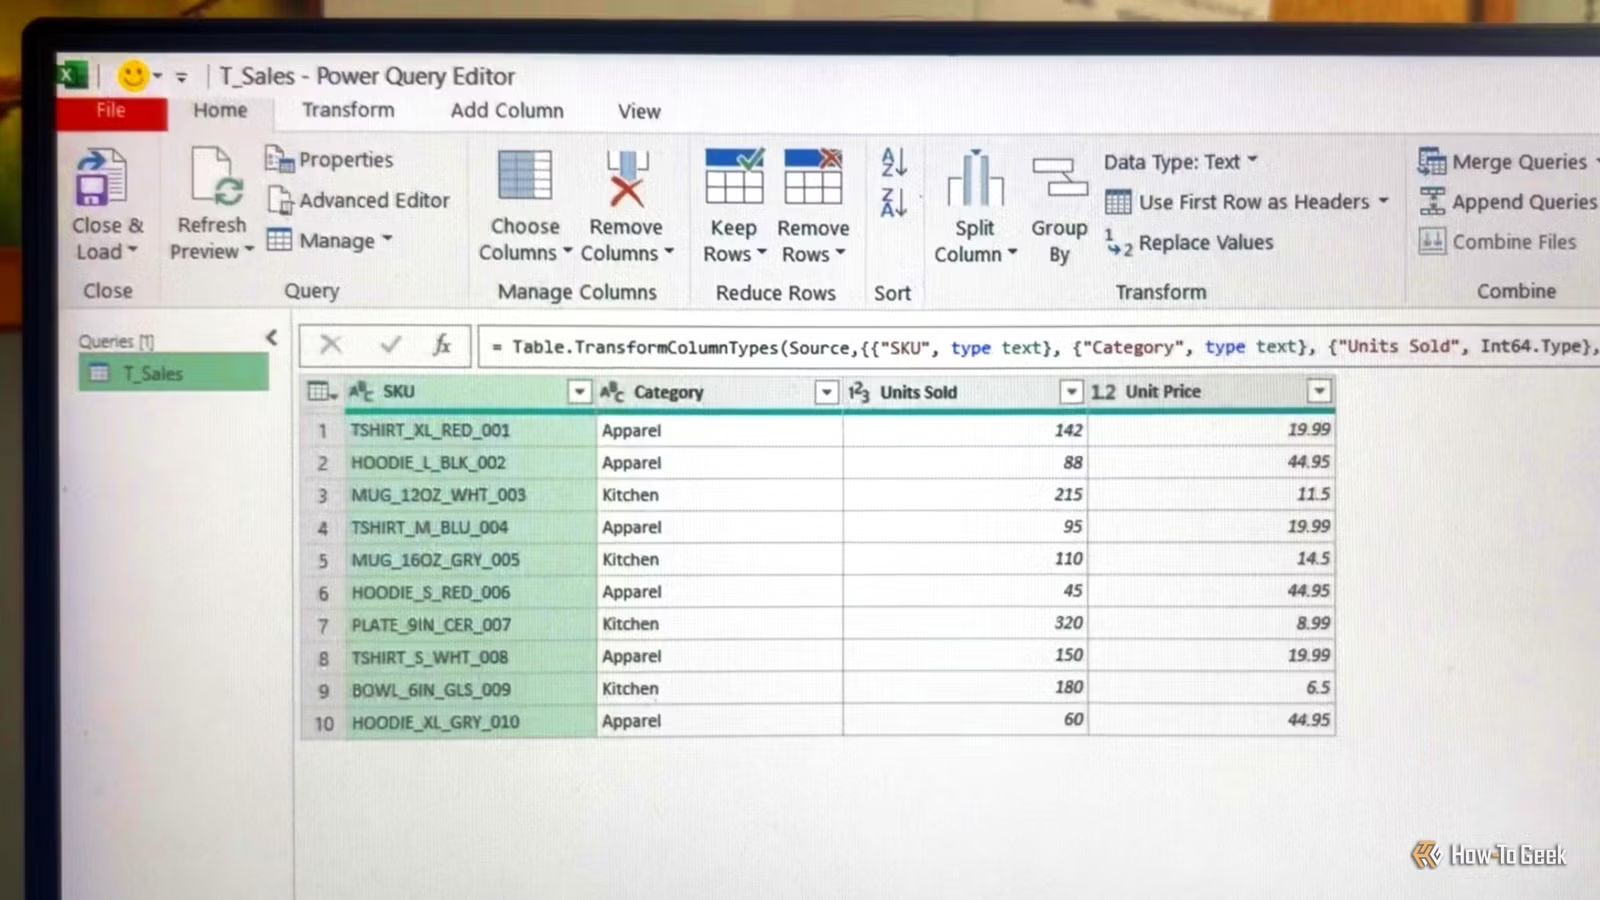
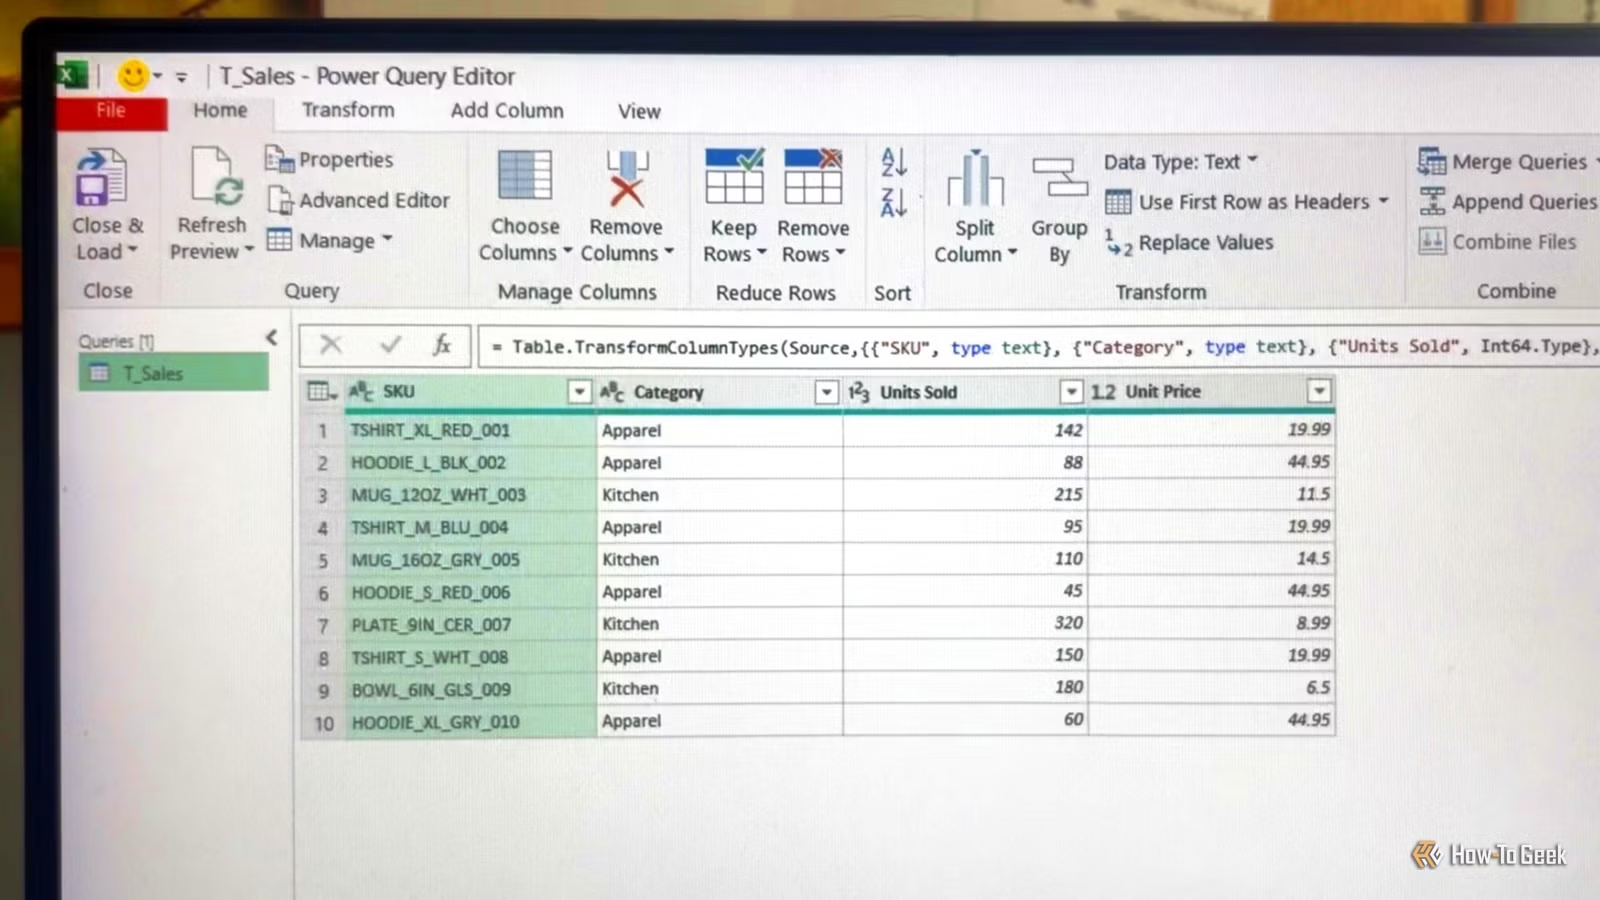
Power Query is a data transformation engine built into Excel (and Power BI). Instead of writing formulas that reference specific cells—formulas that break when data shifts or columns move—you record a series of transformation steps. These steps automatically replay every time your data refreshes.
Think of it as macros for data cleaning, but without the security warnings, VBA knowledge, or IT department involvement.
The Business Case in 30 Seconds
A mid-size company's finance team typically spends 15-20 hours weekly on data manipulation tasks. Power Query can automate 80% of this work. At a blended rate of $75/hour, that's $45,000-$60,000 in annual productivity recovered per team. No software purchase required—it's already in your Excel license.
How Does Power Query Compare to Traditional Excel Formulas?
Most Excel power users rely on nested formulas: VLOOKUP wrapped in IFERROR, combined with LEFT and MID functions, maybe some INDEX-MATCH for good measure. These work until they don't.
| Factor | Traditional Formulas | Power Query |
|---|---|---|
| Maintenance | Breaks when data structure changes | Adapts automatically to new data |
| Auditability | Hard to trace nested logic | Clear step-by-step history |
| Repeatability | Manual refresh required | One-click refresh for all transformations |
| Learning curve | Familiar but limited | New interface, unlimited power |
| Error handling | Requires complex IFERROR nesting | Built-in error handling per step |
The real difference shows up at scale. A VLOOKUP across 50,000 rows makes Excel crawl. Power Query handles millions of rows without breaking a sweat because it processes data before loading it into your worksheet.
Power Query Workflows That Save Hours Weekly
Let's get specific about what Power Query actually does for business operations. These five workflows cover 90% of use cases I see in finance, operations, and sales teams.
1. Extract Clean Data from Messy Text Fields
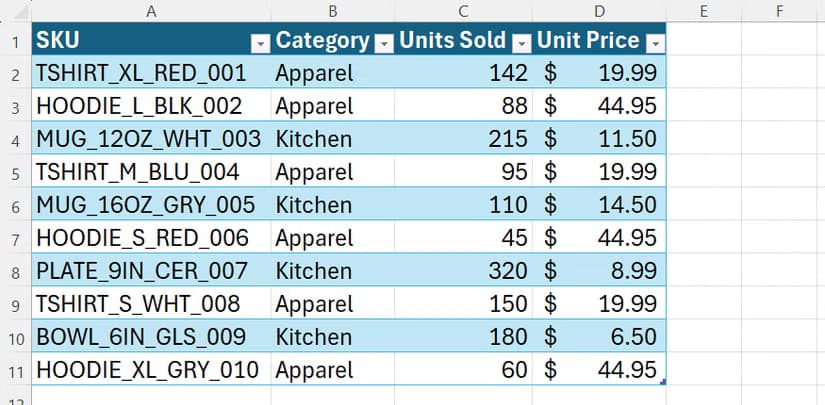
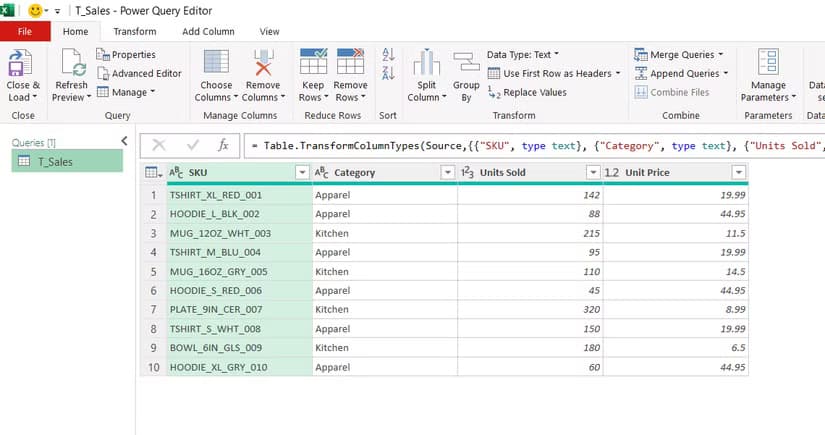
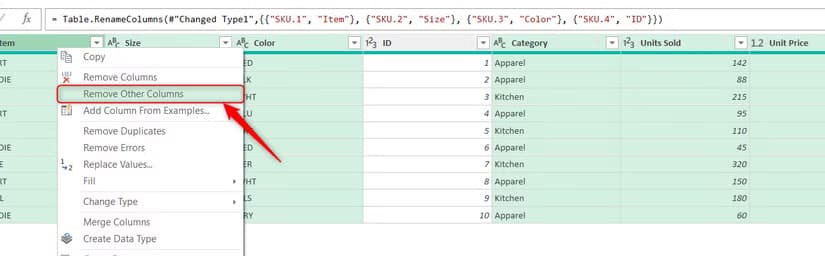
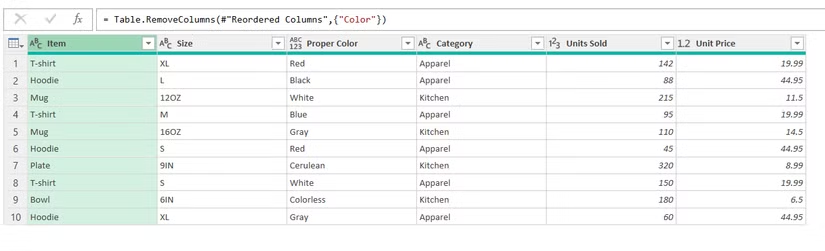
Your ERP exports product codes like "TSHIRT_XL_RED_001" and you need separate columns for item type, size, and color. In traditional Excel, this requires nested MID, FIND, and SUBSTITUTE formulas that nobody can maintain after you write them.
In Power Query, you click "Split Column by Delimiter," choose underscore, and you're done. The steps are recorded. Next month's data gets the same treatment automatically.
2. Combine Multiple Data Sources Without VLOOKUP
Sales data lives in one system. Customer details in another. Product costs in a third. Traditional approach: export everything, VLOOKUP to death, pray nothing breaks.
Power Query's Merge feature joins tables like a database. You define the relationship once. Every refresh pulls current data from all sources and joins them automatically.
3. Summarize Thousands of Rows Without PivotTables
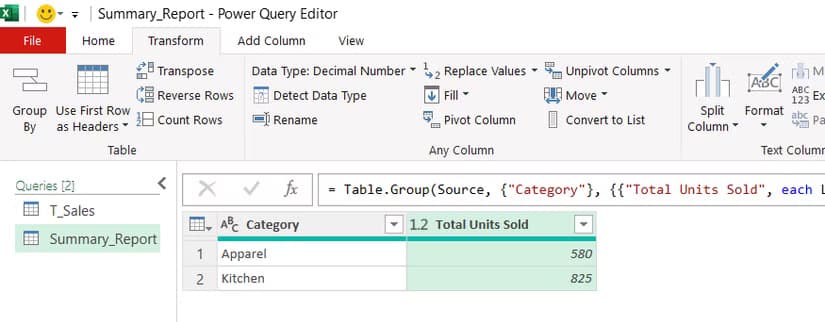
PivotTables are powerful but clunky. They require specific data formats, don't play well with formulas, and confuse half your team. Power Query's Group By function creates summaries that output directly to regular Excel tables.
Group 50,000 transactions by region, calculate totals, averages, and counts, then output a clean summary table. Refresh next month and the new data flows through the same logic.
4. Standardize Inconsistent Data Formats
One system exports dates as "04/21/2026." Another uses "21-Apr-26." Your CRM sends "April 21, 2026." Power Query's data type detection and custom formatting handles all of this in a single transformation step.
5. Connect Directly to Live Data Sources
Stop downloading CSV exports. Power Query connects directly to databases, SharePoint lists, web APIs, and cloud services. Your reports pull live data every time you refresh.
How AI tools are changing business reporting workflows
What Does Power Query Implementation Actually Cost?
This is where Power Query stands out from other automation tools: it costs nothing extra. If your organization has Microsoft 365 licenses, you already have Power Query. It's been included in Excel since 2016.
✅ Pros
- • Zero software cost—included in existing Excel licenses
- • No IT approval or installation required
- • Works with existing Excel files and workflows
- • Skills transfer directly to Power BI for advanced reporting
- • Auditable transformation steps satisfy compliance requirements
❌ Cons
- • Learning curve for teams unfamiliar with data transformation concepts
- • Not available in Excel Online (desktop only)
- • Complex transformations require M language knowledge
- • Some legacy Excel versions have limited Power Query features
The real cost is training time. Budget 4-8 hours for a finance professional to become proficient with basic workflows. Advanced users who want to write custom M code will need 20-40 hours of practice.
How Long Does Power Query Take to Implement?
Most organizations see measurable time savings within 30 days. The key is starting with your most painful, most repetitive data task—not trying to transform everything at once.
Is Power Query Worth the Investment for Small Teams?
Absolutely—in fact, small teams benefit most. Large enterprises often have dedicated data engineering teams and proper ETL tools. Small businesses have Sarah in accounting spending three days a month copying data between spreadsheets.
If your team spends more than 5 hours monthly on repetitive data tasks in Excel, Power Query pays for its learning curve in the first quarter.
Understanding the business value of automation and AI infrastructure
Power Query vs. Hiring a Data Analyst: The ROI Calculation
Companies often hire data analysts to solve problems that Power Query handles automatically. Let's do the math.
- Junior data analyst salary: $55,000-$75,000 annually
- Power Query training for existing team: $2,000-$5,000 one-time
- Time to proficiency: 2-4 weeks vs. 3-6 months for a new hire
- Institutional knowledge: Existing team already understands your data
This isn't an argument against hiring analysts—complex organizations need them. But if your "data problem" is really a "manual spreadsheet cleanup problem," Power Query is the answer.
Common Power Query Mistakes Business Leaders Should Avoid
- Starting too big: Begin with one painful report, not a company-wide transformation
- Skipping documentation: Name your query steps clearly so others can maintain them
- Ignoring error handling: Build queries that gracefully handle missing or changed data
- Not backing up working queries: Export your queries before major changes
- Overcomplicating simple tasks: If a basic Excel formula works, don't force Power Query
Logicity's Take
We build automation systems for startups and mid-size companies, and here's what we've learned: Power Query is the gateway drug to real data automation. It's where finance teams discover that data transformation doesn't require software engineers. At Logicity, we often see clients start with Power Query for Excel reporting, then graduate to Power BI, and eventually need custom data pipelines using tools like n8n or Python. That progression is healthy. Power Query teaches the fundamental concepts—transformation steps, data types, joins, error handling—that apply to every automation tool. For Indian businesses specifically, Power Query solves a real problem: expensive software licenses. Enterprise ETL tools cost lakhs annually. Power Query costs nothing if you're already using Microsoft 365. We recommend every finance and operations team spend one week learning it. The ROI is immediate and the skills compound as you tackle more complex automation projects.
Frequently Asked Questions
Frequently Asked Questions
How much does Power Query cost for businesses?
Power Query is free—it's included in Microsoft 365 and standalone Excel 2016 and later. There's no additional licensing cost. Your only investment is training time, typically 4-8 hours for basic proficiency.
Is Power Query difficult to learn for non-technical staff?
No. Power Query uses a visual, point-and-click interface for most operations. Staff comfortable with Excel formulas can learn basic Power Query workflows in a single afternoon. Advanced features like custom M code require more investment.
Can Power Query replace our BI tools like Tableau or Power BI?
Not entirely. Power Query handles data transformation—cleaning, merging, and shaping data. It doesn't create visualizations or dashboards. However, Power Query skills transfer directly to Power BI, making it excellent preparation for BI tool adoption.
How long does it take to see ROI from Power Query implementation?
Most teams see measurable time savings within 30 days. If your current reporting process involves significant manual data manipulation, you'll likely save that time on your very first automated report refresh.
Does Power Query work with Mac versions of Excel?
Yes, but with limitations. Power Query was added to Excel for Mac in 2019 but has fewer features than the Windows version. Web-based connections and some data sources may not work on Mac. Check Microsoft's current feature comparison before relying on it.
Practical tech solutions for avoiding lost productivity
The Bottom Line for Business Leaders
Power Query isn't glamorous. It won't make headlines like AI tools or blockchain projects. But it solves a problem that costs mid-size companies real money: manual data manipulation that eats hours every week and introduces errors into critical reports.
Your team already has access to it. The learning curve is reasonable. The ROI is measurable within 30 days. The only question is why you're still waiting.
Need Help Implementing This?
Logicity helps businesses automate repetitive data workflows using Power Query, Power BI, and custom integration tools. Whether you need training for your finance team or end-to-end automation architecture, we can help you recover those 15+ hours weekly. Contact us to discuss your specific data challenges.
Source: How-To Geek
Huma Shazia
Senior AI & Tech Writer
Produced with AI assistance and reviewed by the Logicity editorial team. Learn more in our Editorial Policy.