Key Takeaways
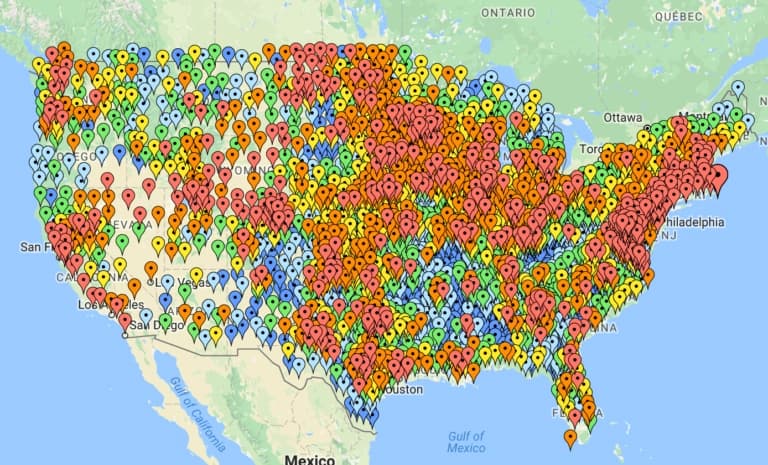
- Traditional clustering hides 90%+ of your location data at any given zoom level
- Displacement algorithms can render 100,000+ markers without hiding a single data point
- Maintaining spatial accuracy improves user trust and reduces support tickets for location-based apps
Read in Short
If your app uses maps with dense markers, clustering is probably hiding most of your data. A displacement approach keeps every marker visible by computing optimal positions based on priority, maintaining geographic accuracy while handling 100,000+ points without performance issues. For businesses relying on location data, this means users actually see what they're looking for instead of clicking through numbered blobs.
Why Does Map Marker Clustering Cost You Users?
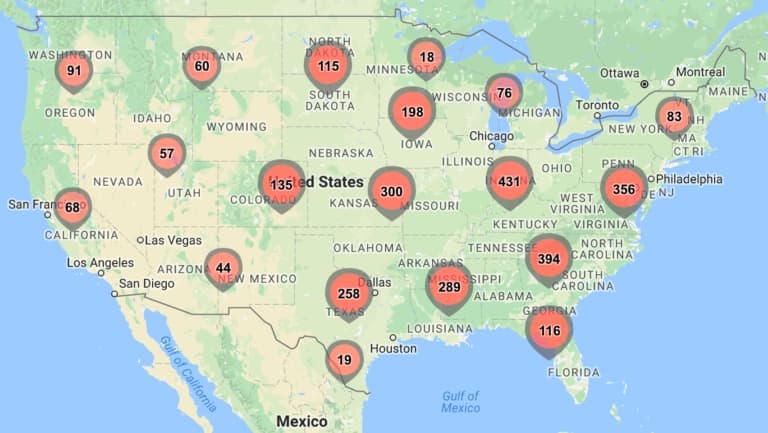
Every product manager who has built a location-based feature knows this problem. You have hundreds or thousands of markers on a map. Maybe they're retail locations, delivery points, real estate listings, or service areas. The map becomes slow and unusable. So you implement clustering, the standard solution every major mapping provider offers.
Problem solved? Not quite. You just traded one UX nightmare for another.
“Clustering hides your data. It forces users to click blindly, hoping the blob they are expanding actually contains what they are looking for.”
— Marko Smiljanic, Creator of Arenarium Maps
Think about what clustering actually does to your users. They see a circle with the number '47' on it. They click. Now they see several circles with smaller numbers. They click again. Maybe after three or four clicks, they finally see the actual location they wanted. Or maybe they give up and leave your app entirely.
For businesses, this creates real problems. Support tickets increase because users can't find specific locations. Conversion rates drop because the friction between 'I want to see this' and 'I can see this' is too high. And perhaps worst of all, you lose the spatial context that makes map data valuable in the first place.
How Does the Displacement Alternative Work?
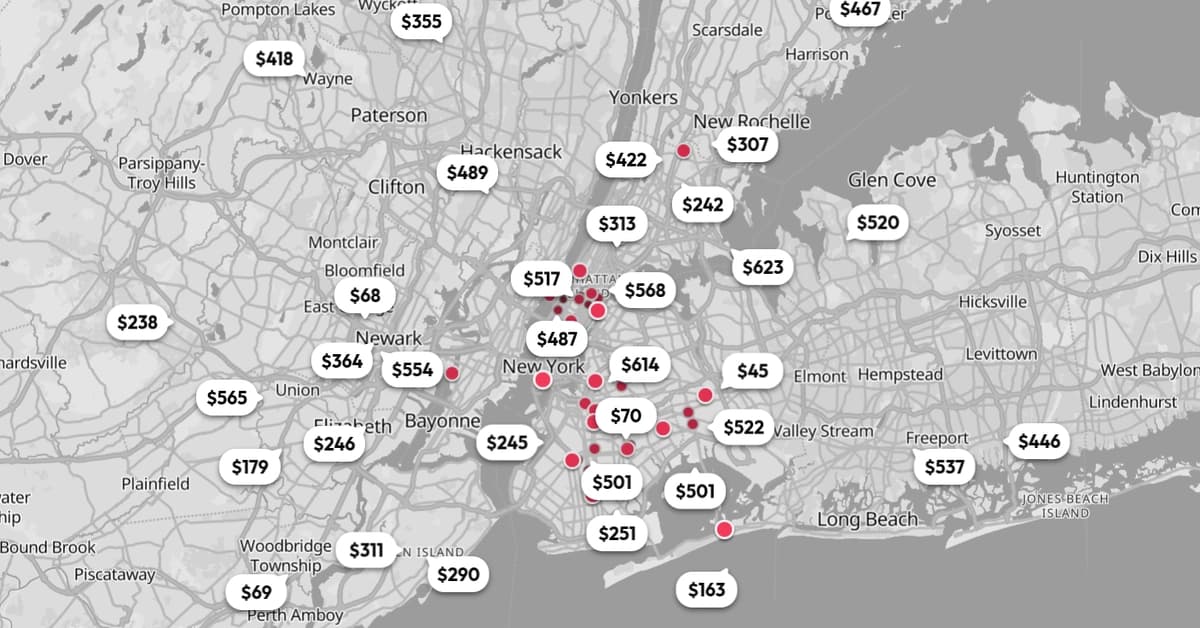
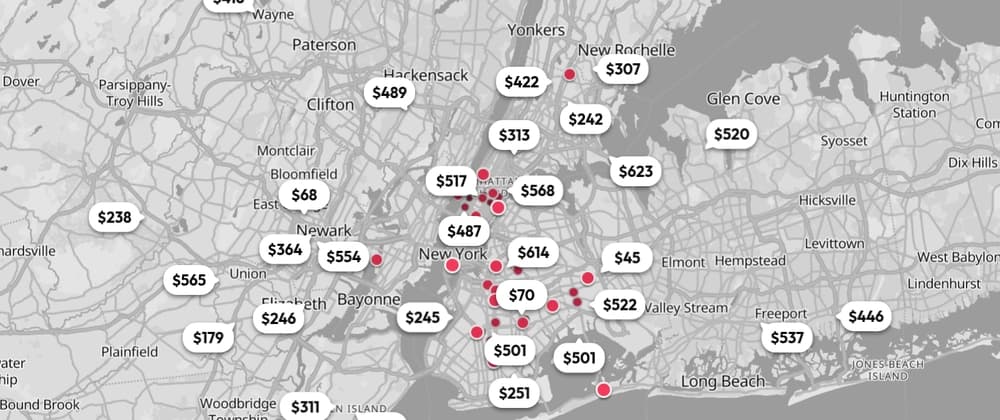
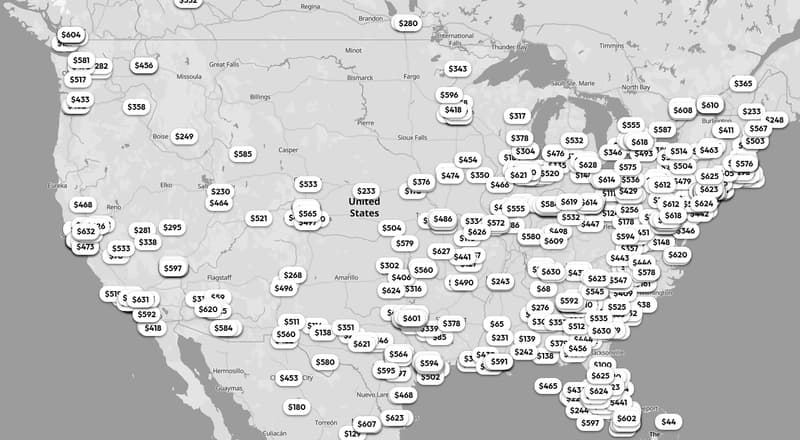
The core insight behind displacement technology is simple: the problem isn't too many markers. The problem is overlapping markers. If you can position each marker so it doesn't overlap with others, you don't need to hide anything.
Arenarium Maps, a library built by software engineer Marko Smiljanic, implements this approach through what it calls 'optimal state computation.' Instead of merging nearby markers into a single blob, the system calculates the best position and angle for each marker based on a priority ranking you define.
The result is striking. Every marker remains visible. Every marker stays at its actual geographic coordinate. Users can see the full picture at every zoom level without clicking through layers of abstraction.
“The goal isn't just to make the map faster, but to maintain geographical and contextual precision that clustering traditionally sacrifices.”
— Marko Smiljanic, Software Engineer
The technical architecture splits into two parts: a core library that manages state logic and coordinates with an optimization API, and integration packages that work as abstraction layers for Google Maps, Mapbox, and MapLibre. This means you can likely implement it with whatever mapping provider you're already using.
Map Marker Clustering vs Displacement: Which Should You Choose?
| Factor | Traditional Clustering | Displacement Approach |
|---|---|---|
| Data Visibility | Shows 10-20% at dense zoom levels | Shows 100% at all zoom levels |
| Geographic Accuracy | Markers merge to approximate center | Markers stay at exact coordinates |
| User Clicks Required | 3-5 clicks to reach specific marker | 1 click to interact with any marker |
| Performance at Scale | Good (hides complexity) | Good (optimizes positioning) |
| Implementation Effort | Built into most map SDKs | Requires additional library |
| Best For | Quick implementation, less critical data | High-value location data, precision matters |
The choice depends on what your location data means to your business. If you're showing approximate service areas or general regional coverage, clustering works fine. But if each marker represents a specific customer location, a precise delivery point, or a high-value asset, hiding that data behind numbered blobs costs you clarity and trust.
What's the Business Case for Better Map UX?
Let's talk numbers. Location-based features often sit at critical points in user journeys. Real estate platforms live or die by how easily users can find properties. Logistics dashboards need operators to quickly identify specific delivery points. Field service apps require technicians to locate exact job sites without confusion.
Executive Summary: When Displacement Makes Sense
Consider displacement over clustering when: (1) Each location marker has unique business value, (2) Users need to find specific points rather than browse regions, (3) Geographic precision affects user trust or operational accuracy, (4) You're seeing support tickets related to 'can't find location' issues.
The community response to this approach has been telling. On Hacker News, developers noted that displacement mirrors 'spiderfication' techniques from older GIS tools but scales it across the entire map view. Reddit's JavaScript community praised the library for solving what they called the 'last mile' UX problem, where users lose their sense of place when zooming into a cluster only to find markers still overlapping.
For engineering teams evaluating this approach, the integration model matters. Similar to how modern HTTP client libraries have reduced API integration time significantly, having provider-agnostic tooling means you're not locked into a specific mapping vendor. If you're already working on API integrations, you might find our coverage of HTTP client libraries for Node.js useful for understanding how abstraction layers can cut development time.
Understanding provider-agnostic tooling patterns for faster integration
How Do You Implement a Map Marker Clustering Alternative?
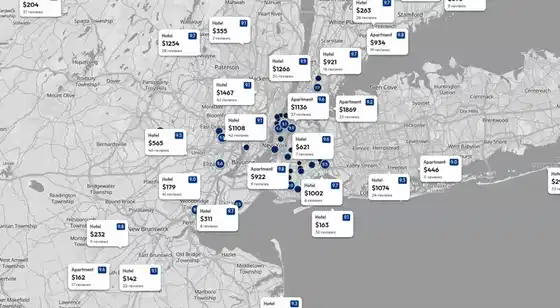
The Arenarium Maps library uses a three-layer marker system that adapts based on zoom level and user interaction:
- The Pin Layer: Round elements showing basic information through colors or icons. These create a heat-map feel at zoomed-out levels without visual clutter.
- The Tooltip Layer: Primary information revealed based on your priority ranking when space allows. Always visible without user interaction.
- The Popup Layer: Extended information shown on click, containing details that would make tooltips too large, like images or detailed descriptions.
Implementation requires installing the core package plus an integration package for your mapping provider. The library handles state computation through an optimization API, which means the heavy lifting happens server-side rather than in the browser.
For teams concerned about adding dependencies, this is worth weighing against the cost of building custom solutions. The same logic applies to any build-vs-buy decision in your stack. If you're also evaluating where to invest engineering resources, our analysis of AI coding tools and their token costs shows how to think about development efficiency trade-offs.
Framework for evaluating developer tooling investments
What Are the Limitations of Displacement Technology?
No solution is perfect for every use case. Displacement works best when you have clear priority rankings for your markers. If all 10,000 of your locations are equally important, the algorithm needs guidance on what to surface first. This requires product thinking about what matters most to your users.
✅ Pros
- • Every data point remains visible and interactive
- • Geographic coordinates stay accurate
- • Reduces user frustration and click fatigue
- • Works with major mapping providers
- • Handles 100K+ markers without performance issues
❌ Cons
- • Requires defining priority rankings for markers
- • Additional dependency in your stack
- • API dependency for optimization computation
- • Less mature than built-in clustering solutions
- • May require design adjustments for existing map UIs
There's also the question of visual density. At extreme zoom-out levels with very high marker counts, displacement can create its own form of visual noise. The markers don't overlap, but the map can still feel crowded. Smart use of the pin layer, showing simplified representations at low zoom, helps manage this.
Frequently Asked Questions
Frequently Asked Questions
How much does implementing a map clustering alternative cost?
Arenarium Maps is an open-source library, so direct licensing costs are zero. Implementation costs depend on your existing map infrastructure and how deeply integrated your current clustering solution is. For most teams, expect 1-2 sprints for initial integration and testing. The optimization API handles computation server-side, which may have usage-based costs at scale.
Is displacement better than clustering for all map applications?
No. Clustering remains appropriate for applications where approximate regional data is sufficient, or where individual marker precision doesn't affect user outcomes. Displacement excels when each location has distinct business value, when users search for specific points rather than browsing areas, or when geographic accuracy impacts trust and usability.
How long does it take to migrate from clustering to displacement?
Migration complexity depends on your current implementation. If you're using standard clustering from Google Maps, Mapbox, or MapLibre, the integration packages provide abstraction layers that simplify the switch. Most teams report 2-4 weeks for full migration including testing, assuming no major custom clustering logic to untangle.
Will displacement work with my existing mapping provider?
Arenarium Maps currently offers integration packages for Google Maps, Mapbox, and MapLibre. These cover the majority of commercial and open-source mapping implementations. If you're using a different provider, the core library's architecture allows for custom integrations, though this requires additional development work.
What happens to performance with 50,000+ markers?
The library is designed to handle 100,000+ markers without browser lag. Performance optimization happens through the server-side computation API rather than client-side processing. This architecture means marker count has minimal impact on rendering speed, though initial load time may increase slightly with very large datasets.
The Bottom Line for Business Leaders
Map clustering became standard because it solved an immediate technical problem: too many markers made maps slow and unusable. But like many technical solutions, it created a user experience trade-off that businesses have accepted for too long.
Displacement technology offers a different approach. Instead of hiding data to improve performance, it repositions data to prevent overlap while maintaining visibility. For businesses where location data drives decisions, conversions, or operational efficiency, this distinction matters.
The question isn't whether displacement is better than clustering in absolute terms. It's whether your specific use case benefits from showing users 100% of your data instead of forcing them to dig through numbered blobs. If each marker on your map represents revenue, customer value, or operational precision, the answer is probably yes.
Need Help Evaluating Your Map Implementation?
Logicity helps engineering teams assess their location-based features and identify UX improvements that drive business outcomes. Whether you're considering displacement technology or optimizing your current clustering approach, we can help you make the right technical decision for your specific use case.
More on integrating third-party services into your stack
Source: DEV Community
Huma Shazia
Senior AI & Tech Writer
Produced with AI assistance and reviewed by the Logicity editorial team. Learn more in our Editorial Policy.