How to Create a Google Sheets Pivot Table in 5 Minutes
Key Takeaways
- Gemini AI can now build pivot tables from a single sentence prompt, cutting setup time dramatically
- Manual pivot tables still offer more control for complex multi-dimensional analysis
- The =QUERY() function serves as a more flexible alternative for experienced analysts
Spreadsheets are great at storing data. They're less great at telling you what the data means. When you're staring at 10,000 rows of sales figures, drawing conclusions from a basic grid view becomes nearly impossible.
Pivot tables solve this problem. They reorganize flat data into summarized views. Instead of seeing individual transactions, you can instantly see totals by region, averages by product, or counts by salesperson.
Excel users have relied on pivot tables for decades. Google Sheets offers the same capability, plus something new: Gemini AI can now build pivot tables from plain English descriptions of what you want to know.
“Pivot tables are THE fastest way to get insight into your data in Google Sheets. To replicate what pivot tables can do with formulas alone is tedious, time-consuming, and error-prone.”
— Ben Collins, Google Developer Expert for Google Workspace
What Pivot Tables Actually Do
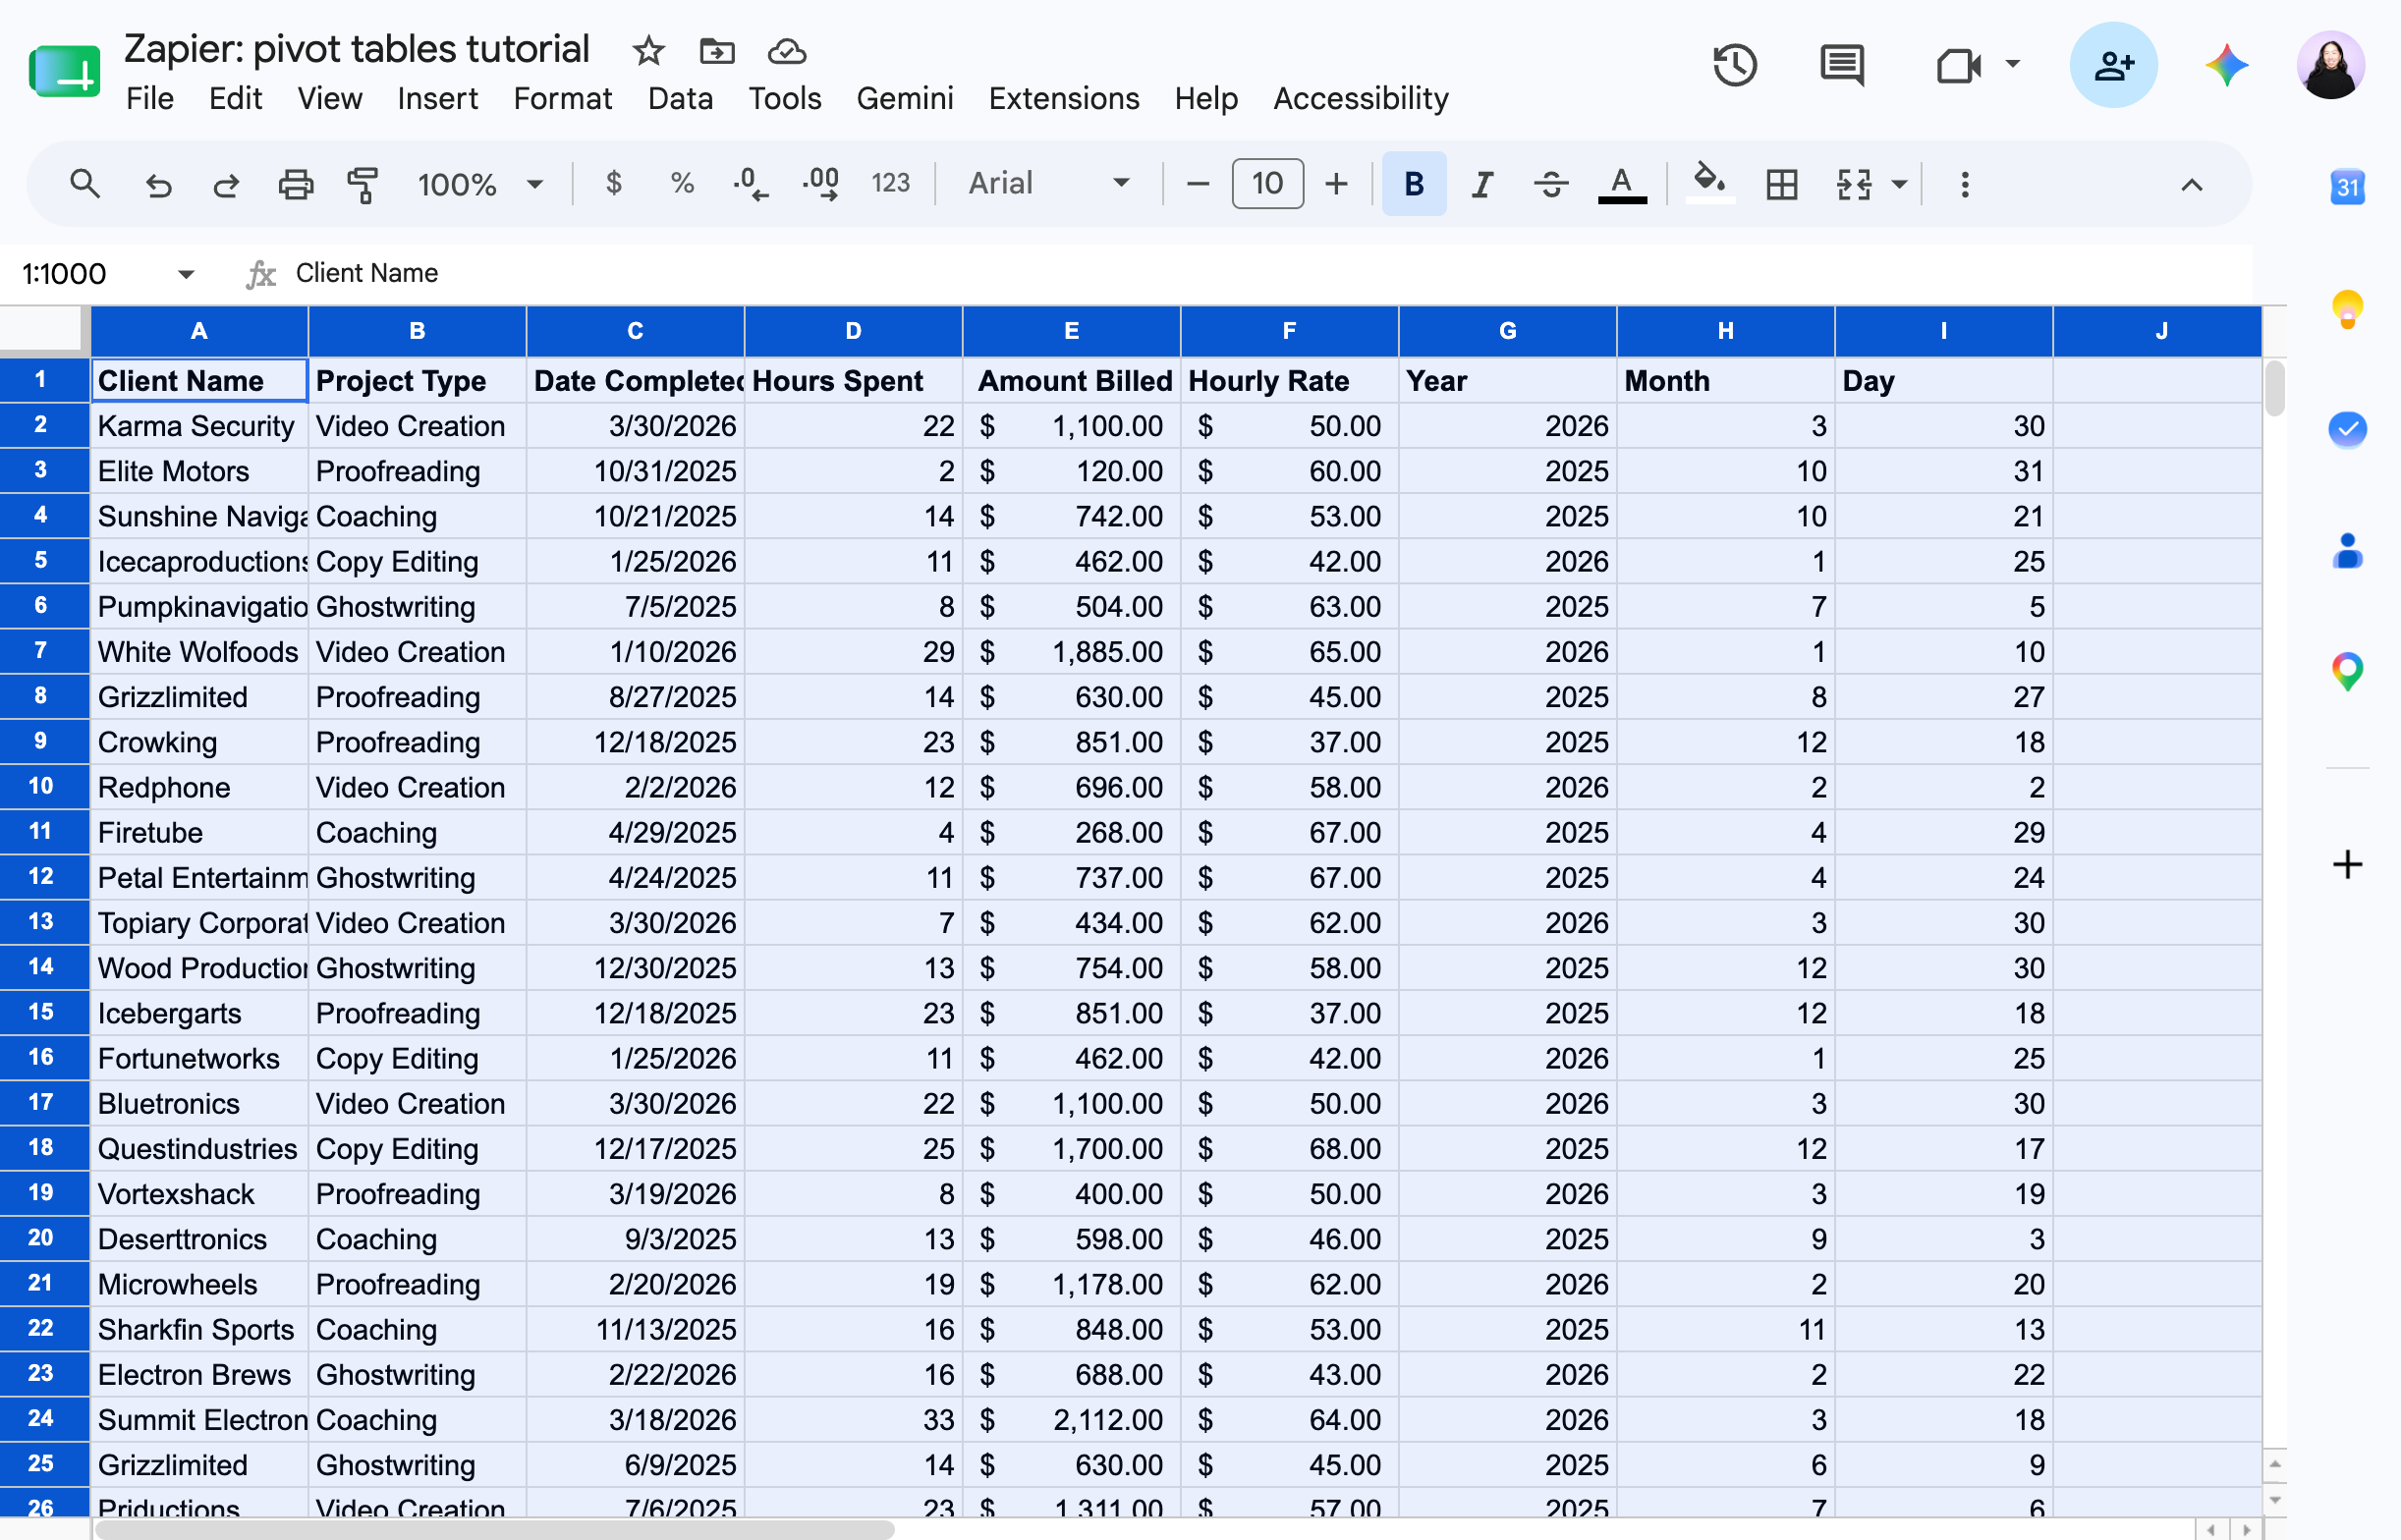
Normal spreadsheets show flat data on two axes: columns running horizontally and rows running vertically. A sales team might track individual sales in rows, with columns for date, customer, product, and amount.
A pivot table adds a third dimension. It shifts (or pivots) those axes so you can see aggregated data. Instead of 500 individual sales rows, you see one row per sales rep showing their total units sold, broken down by product category.
You could pull these same insights using formulas like SUMIF, COUNTIF, and AVERAGEIF. But pivot tables do it in seconds, with drag-and-drop configuration, and with far less chance for human error.
The Gemini AI Method: One Sentence Setup
Google's Gemini AI integration changes the pivot table workflow entirely. Instead of configuring rows, columns, and values manually, you describe what you want to know in plain English.
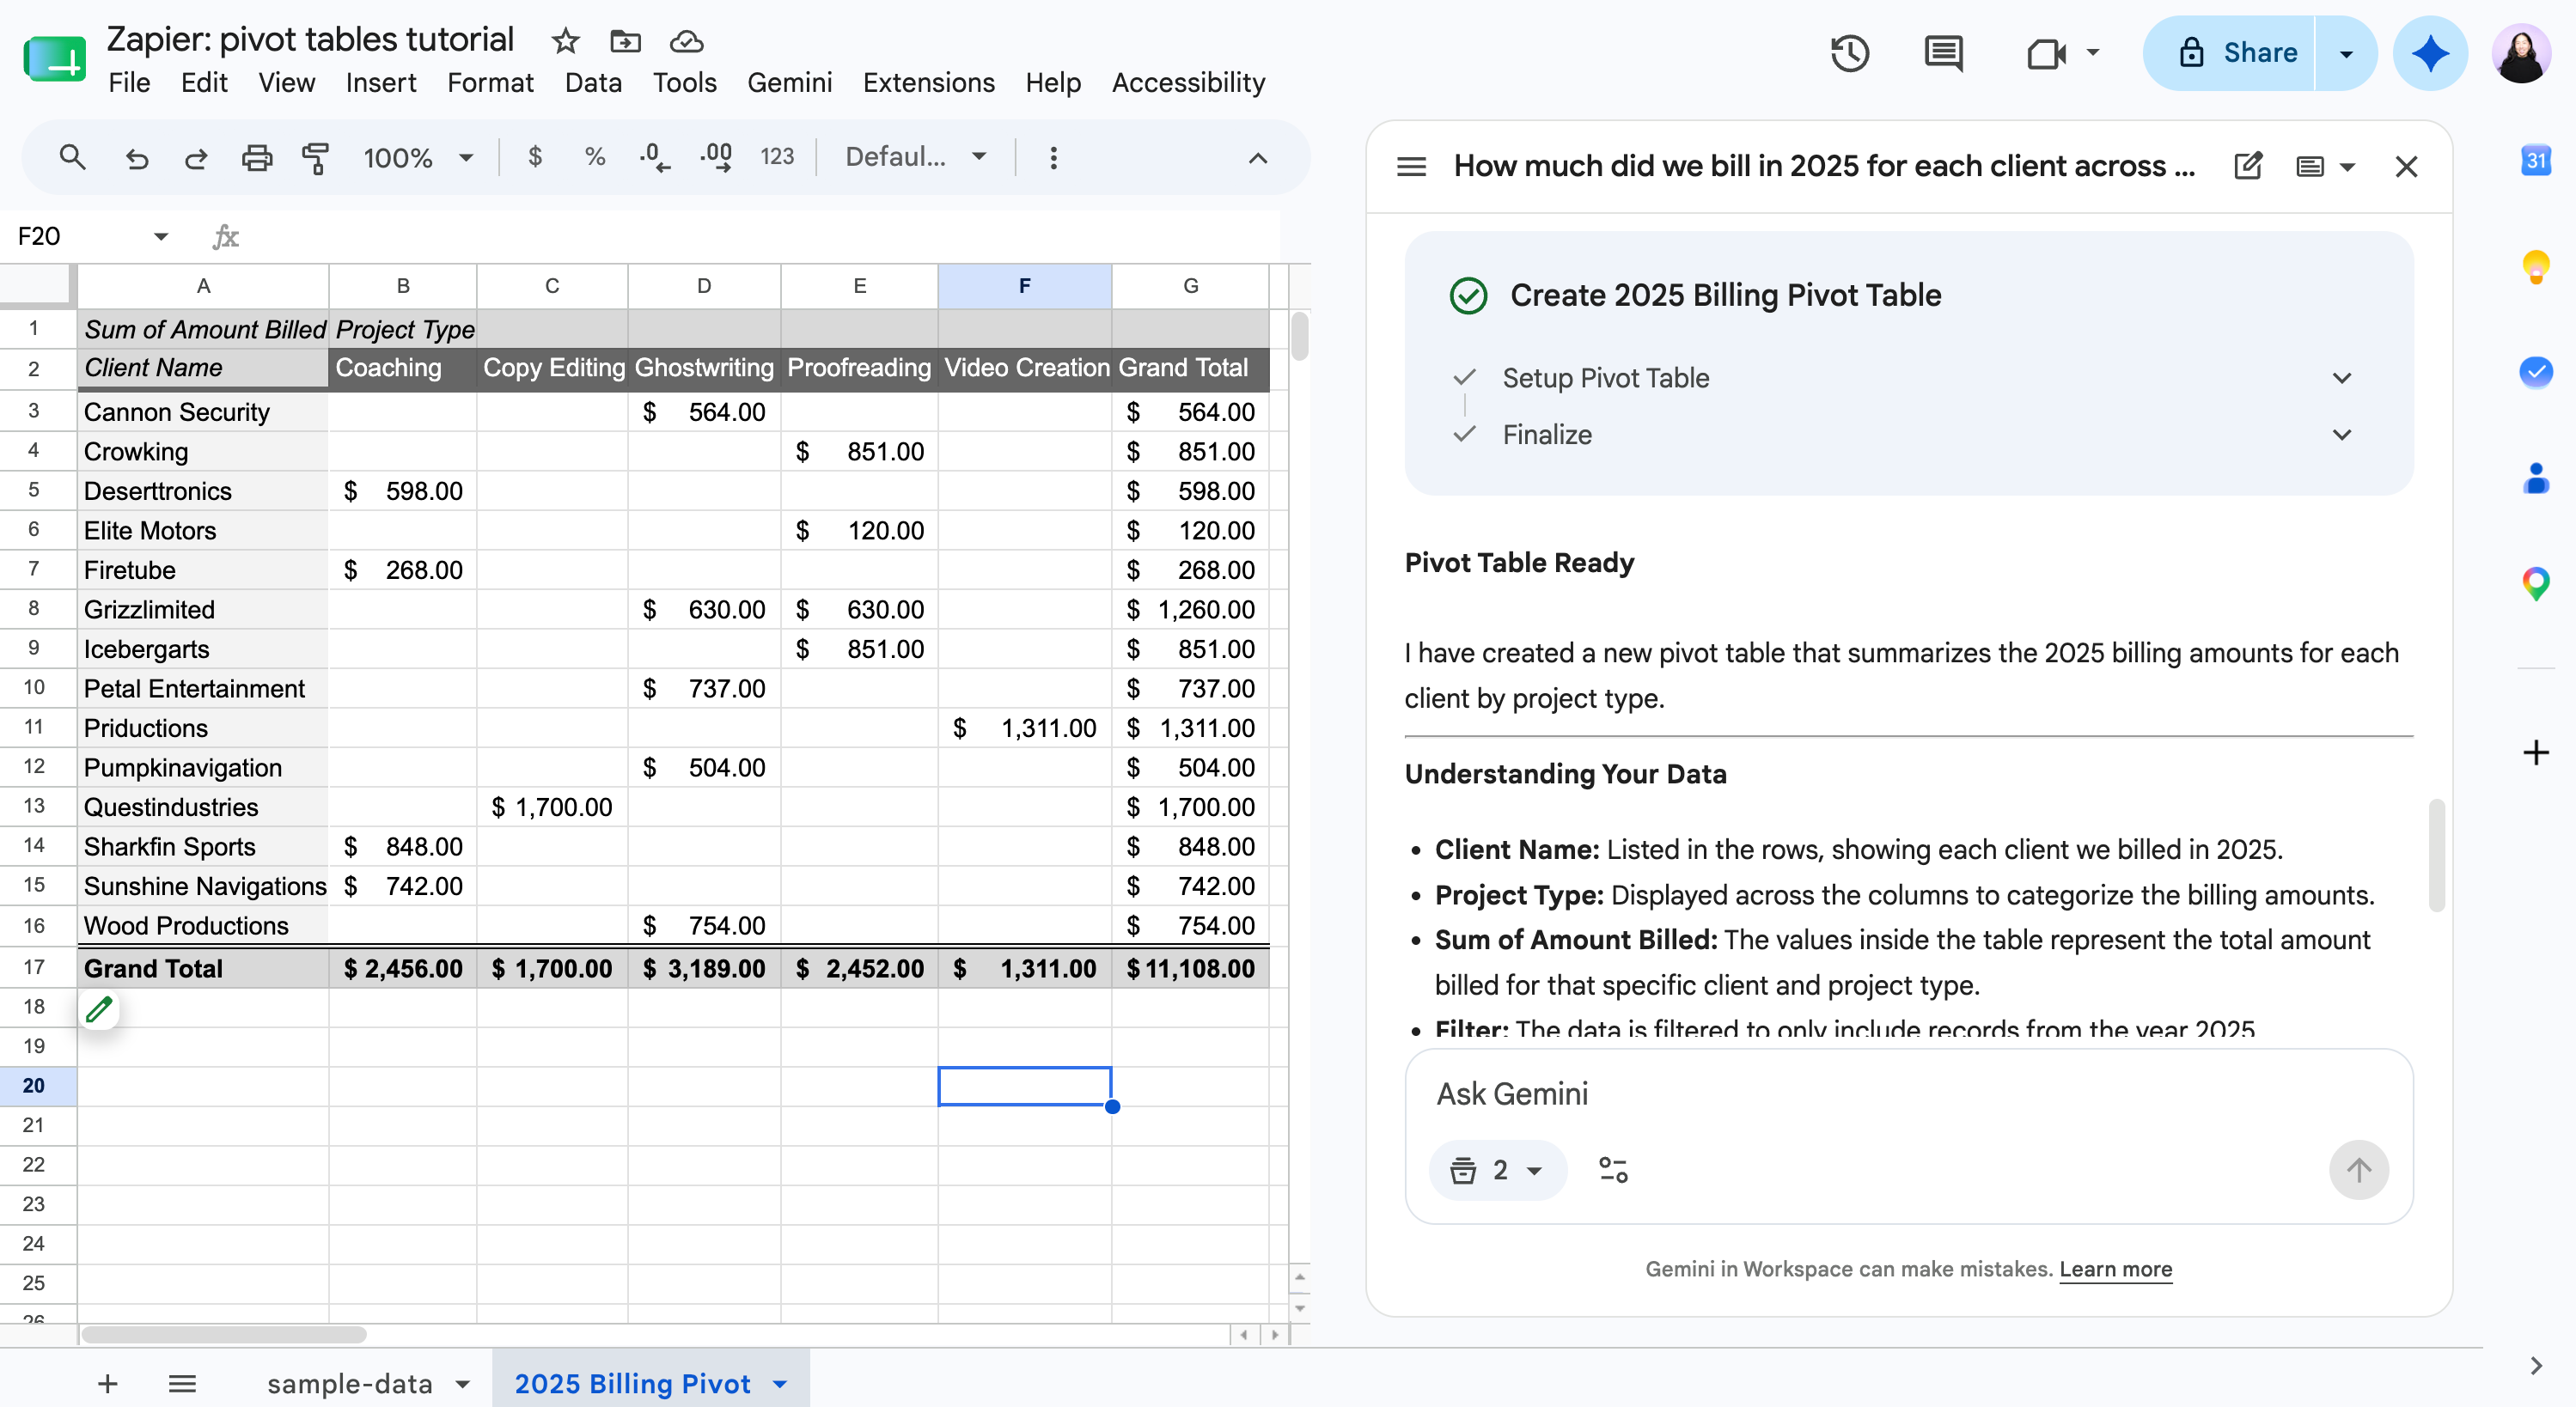
Example prompt: "Create a pivot table showing how much we billed in 2025 for each client across different project types."
Gemini interprets the request, identifies the relevant columns in your data, and builds the pivot table automatically. It even generates a summary explaining how it used your data.
This approach works best when your question is clear and your column headers are descriptive. If Gemini misunderstands your intent, you can refine the prompt or switch to manual configuration.
The Manual Method: Step by Step
Manual pivot table creation gives you more control. Here's how to build one from scratch.
- Select your entire dataset, including column headers
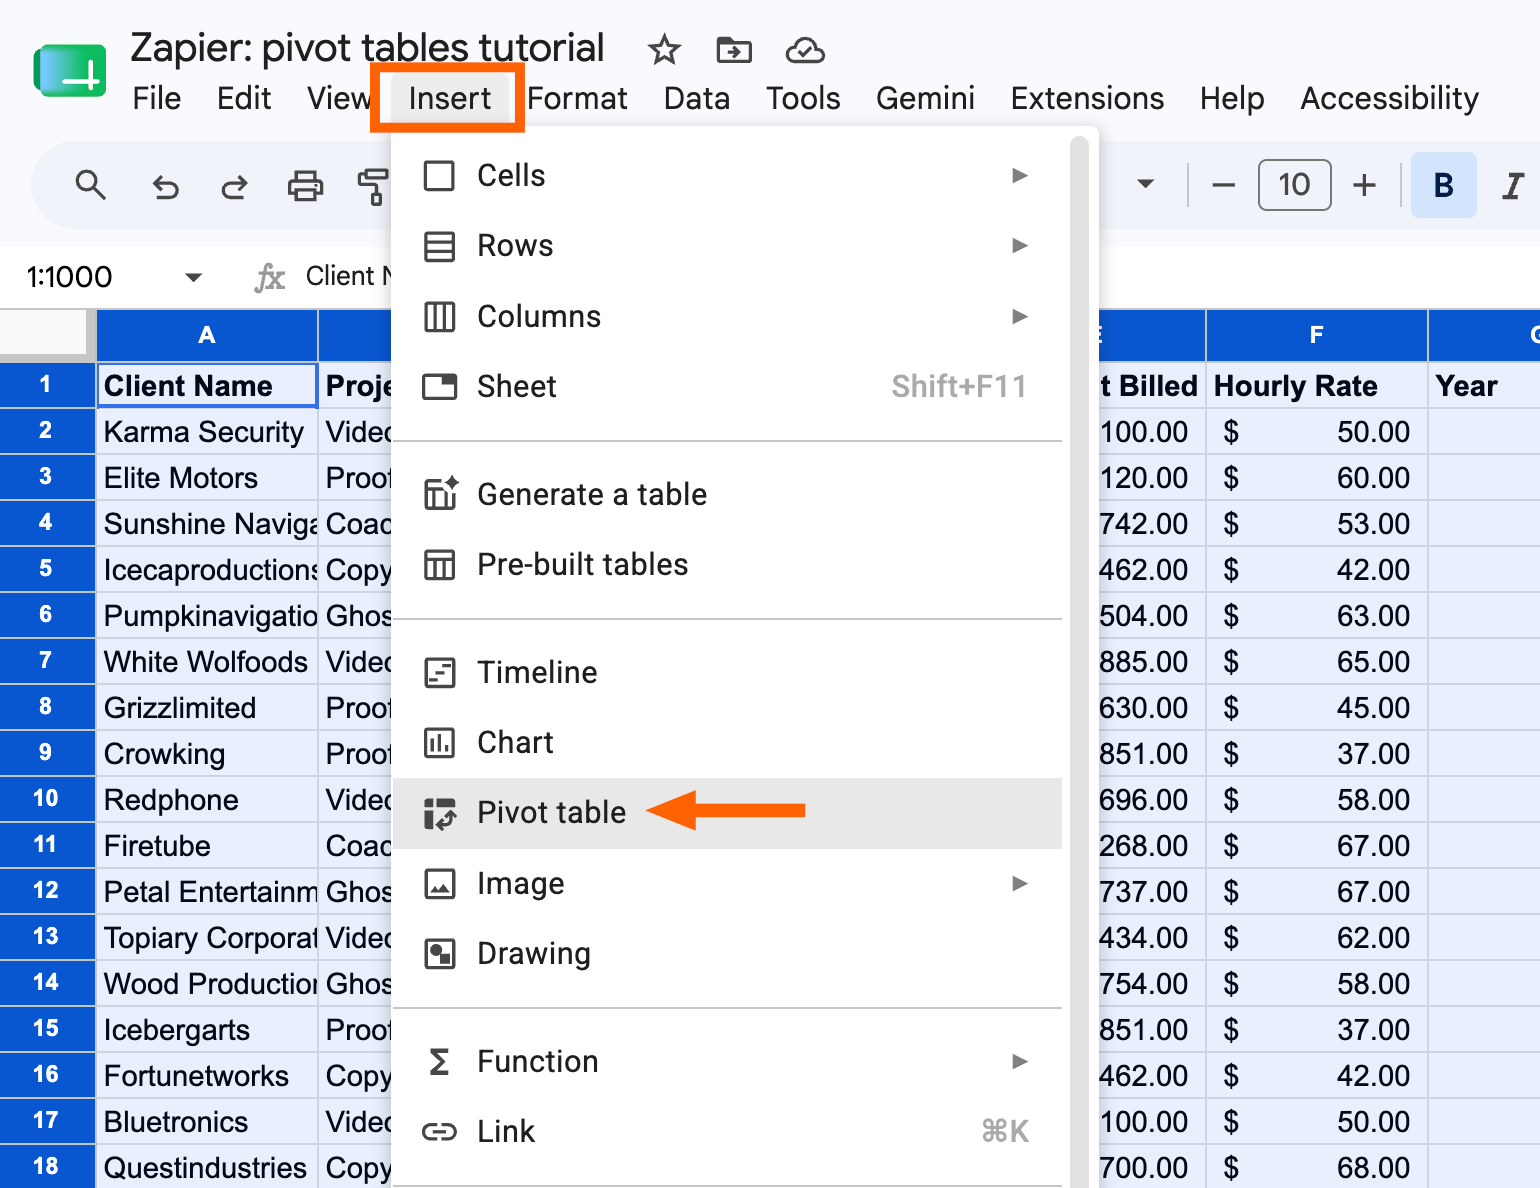
- Go to Insert > Pivot table
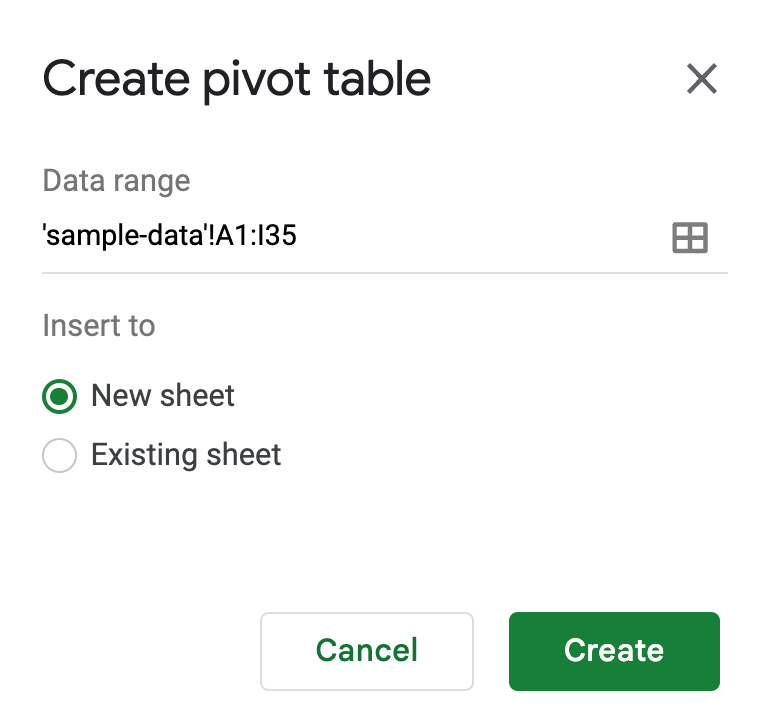
- Choose whether to place the pivot table in a new sheet or existing location
- In the pivot table editor, add fields to Rows, Columns, Values, and Filters
The pivot table editor appears as a sidebar. This is where you configure what data to show and how to aggregate it.
Understanding Rows, Columns, and Values
Rows determine what appears on the left side of your pivot table. If you add "Sales Rep" to Rows, each sales rep gets their own row.
Columns determine what appears across the top. Adding "Product Category" to Columns creates one column per category.
Values are the numbers you want to calculate. Adding "Revenue" to Values shows revenue figures. You choose the aggregation method: sum, average, count, min, max, or others.
Filters let you narrow the data before aggregation. Adding "Year" as a filter and selecting "2025" means the pivot table only includes 2025 transactions.
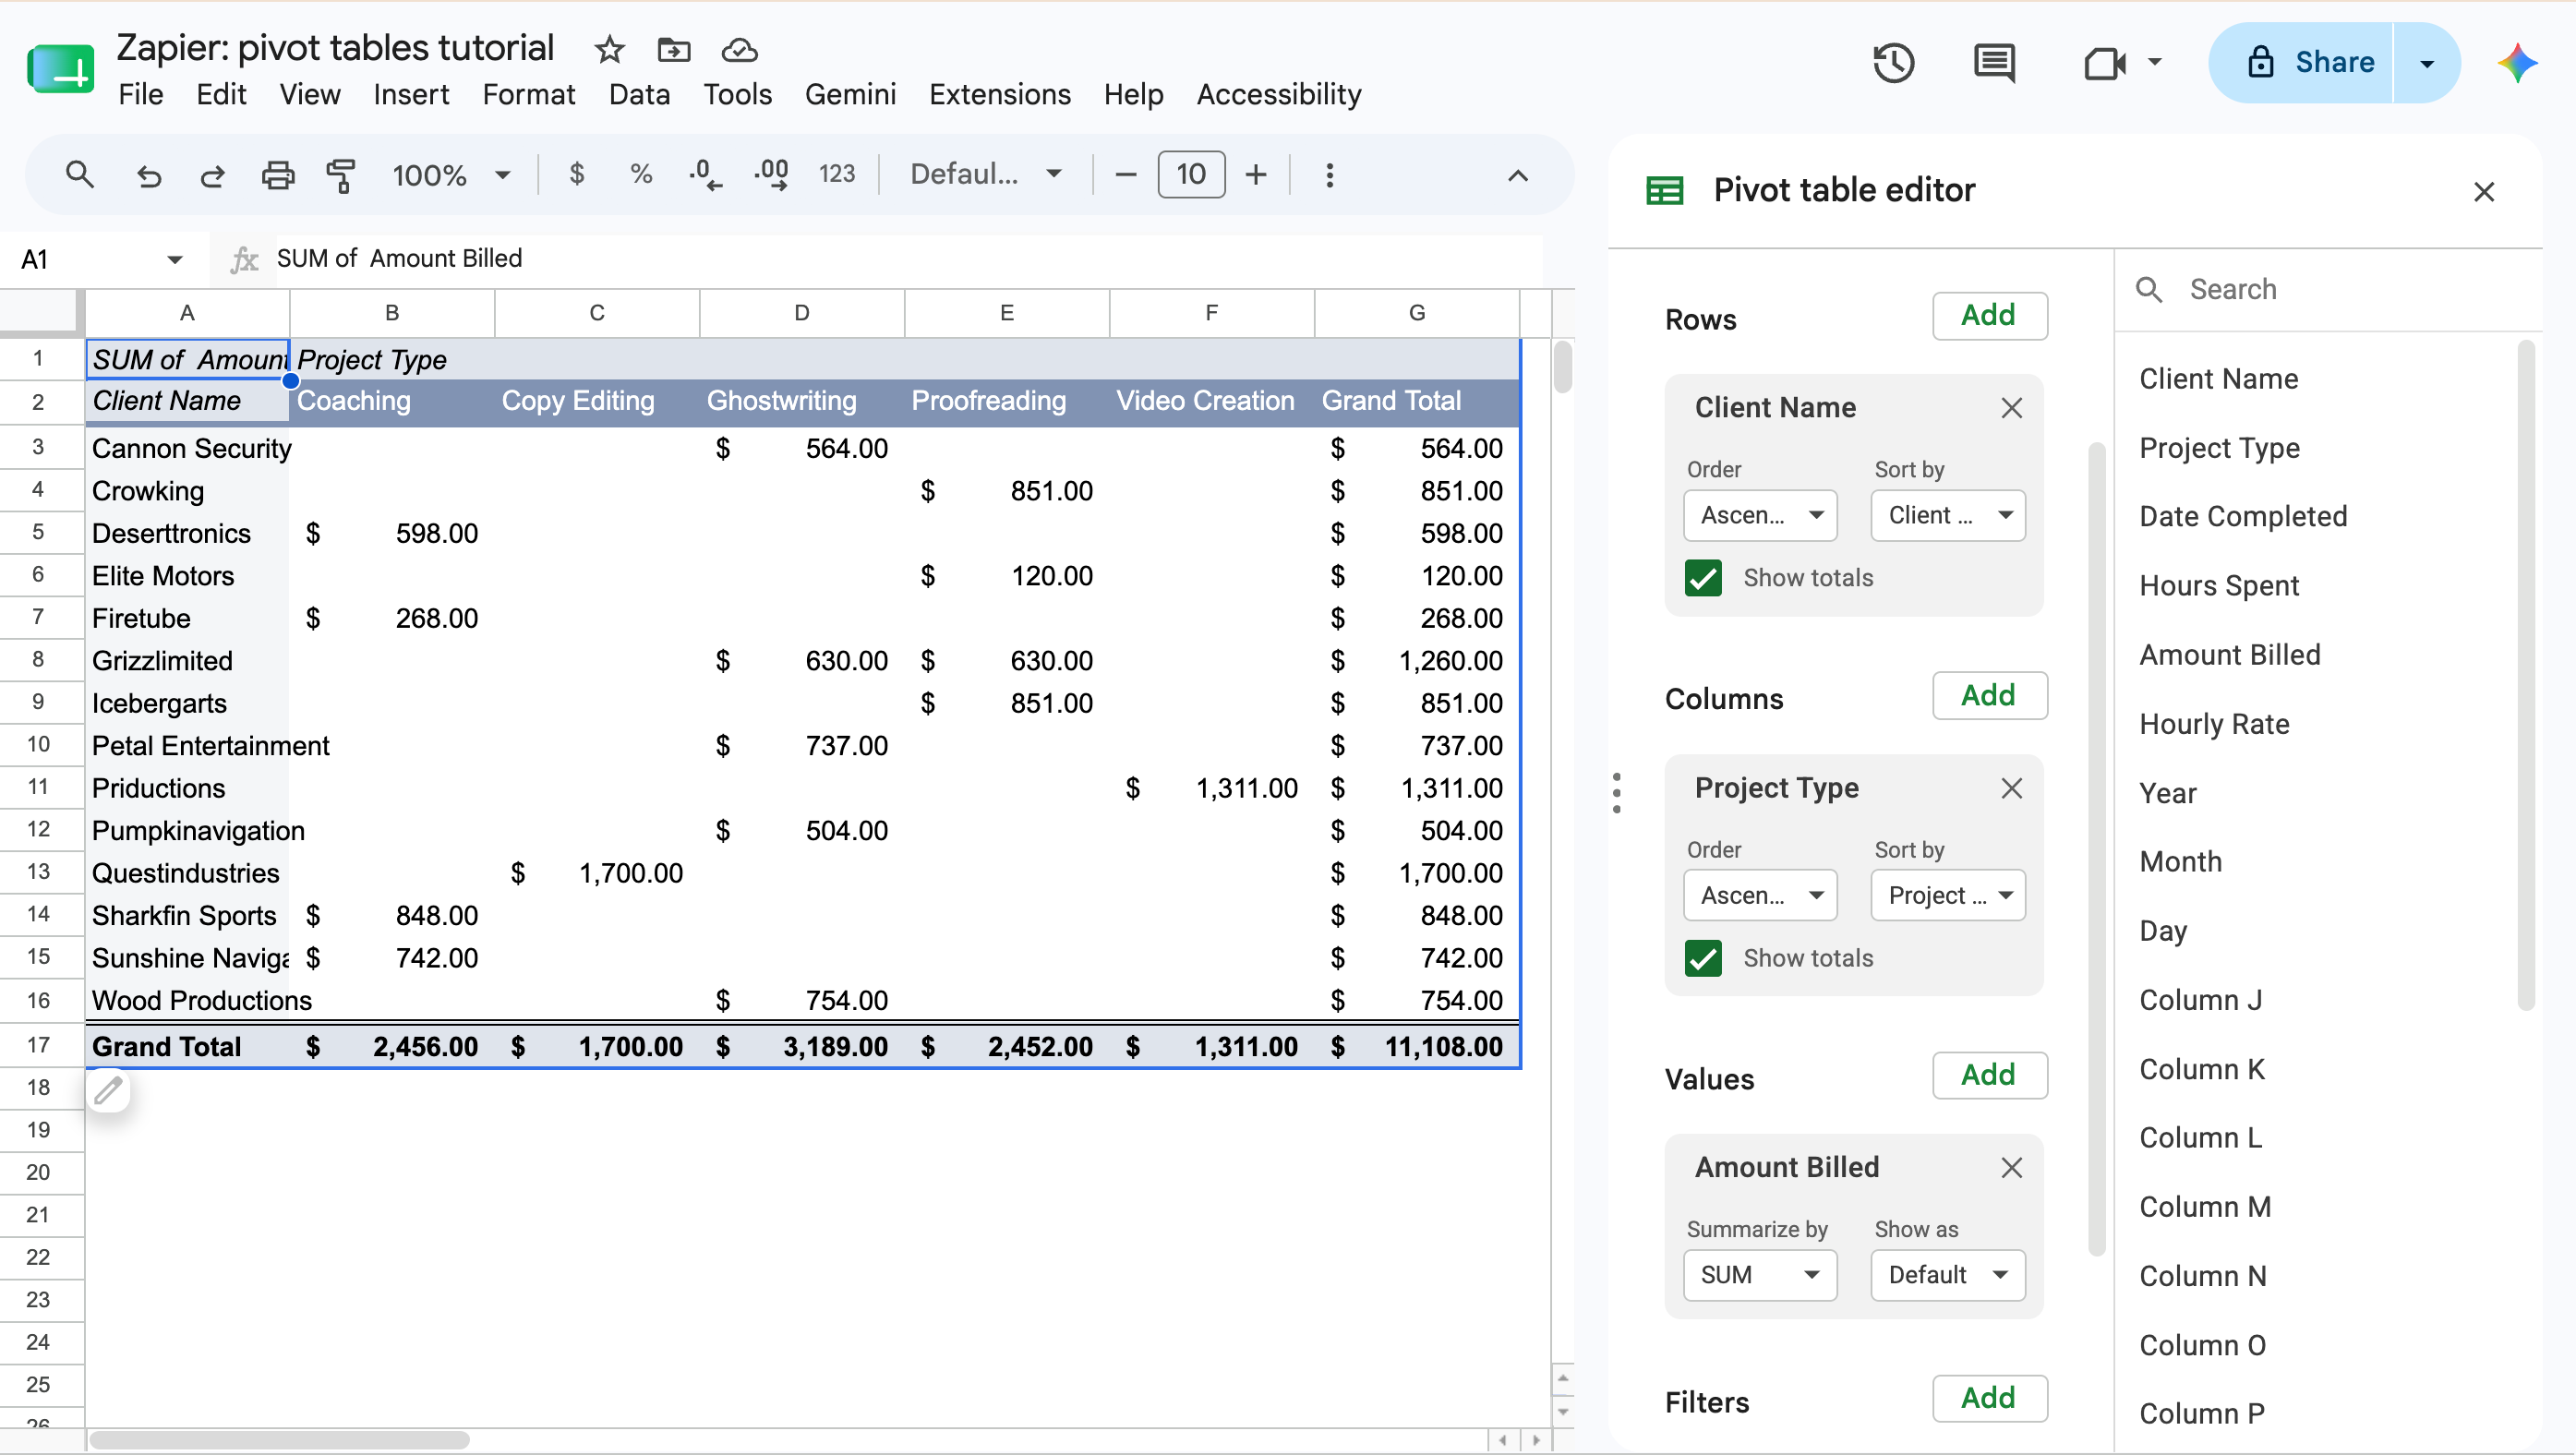
A Practical Example
Question: How much did we bill in 2025 for each client across different project types?
- Rows: Client name
- Columns: Project type
- Values: Billing amount (Sum)
- Filters: Year = 2025
The resulting pivot table shows one row per client, one column per project type, with billing totals in each cell. Grand totals appear at the bottom and right edges.
Refreshing Pivot Table Data
Pivot tables in Google Sheets update automatically when source data changes. If you add new rows to your original dataset, the pivot table reflects those additions immediately.
One exception: if you add rows outside the original data range you selected, you'll need to update the pivot table's data range. Click the pivot table, then click the data range in the editor sidebar to expand it.
When to Use =QUERY() Instead
Power users in Reddit communities like r/sheets often recommend the =QUERY() function as an alternative to pivot tables. The function uses a SQL-like syntax to filter, aggregate, and transform data.
QUERY() excels when you need results that update dynamically in specific cells, or when your analysis requires complex conditions that pivot tables handle awkwardly. It's also easier to reference in other formulas.
The tradeoff: QUERY() has a steeper learning curve. Pivot tables offer immediate visual feedback as you drag fields around. QUERY() requires writing correct syntax before you see any results.
Google Sheets vs Excel for Pivot Tables
Both platforms support pivot tables, but they serve different use cases.
Google Sheets wins on collaboration. Multiple team members can edit the same spreadsheet simultaneously. Gemini AI suggestions make pivot creation faster for non-experts. The web-native interface requires no software installation.
Excel wins on scale and advanced features. Google Sheets caps at 10 million cells per spreadsheet. Excel handles larger datasets and offers Power Query for complex data transformation. Professional analysts often prefer Excel's deeper functionality.
Google Workspace currently holds 50.34% of the global productivity software market, slightly leading Microsoft 365. For teams already in Google's ecosystem, Sheets pivot tables avoid the friction of switching tools.
Logicity's Take
Frequently Asked Questions
How do I create a pivot table in Google Sheets?
Select your data range including headers, go to Insert > Pivot table, then use the sidebar editor to add fields to Rows, Columns, Values, and Filters. Alternatively, type a natural language prompt in Gemini to have AI build it automatically.
Do Google Sheets pivot tables update automatically?
Yes. When source data changes within the original range, the pivot table updates immediately. If you add rows outside the original selection, you'll need to expand the data range in the pivot table settings.
What's the difference between pivot tables and the QUERY function?
Pivot tables use a visual drag-and-drop interface for data aggregation. QUERY() uses SQL-like syntax and returns results directly in cells. QUERY() offers more flexibility but requires learning its syntax.
Can Gemini AI create pivot tables in Google Sheets?
Yes. Describe what you want to know in plain English, and Gemini interprets your request and builds the pivot table. It achieved a 70.48% success rate on the March 2026 SpreadsheetBench test.
What are the data limits for Google Sheets pivot tables?
Google Sheets supports up to 10 million cells per spreadsheet. For datasets exceeding this limit, Excel or dedicated data analysis tools are better options.
Need Help Implementing This?
Source: The Zapier Blog
Manaal Khan
Tech & Innovation Writer
Related Articles
Browse all
Business Letter Automation: Cut Admin Time 80%
Business letters still drive deals, partnerships, and compliance. But writing them manually wastes hours that could go toward revenue. Here's how smart automation can handle 80% of your formal correspondence while keeping it professional.

Celigo Alternatives 2026: 7 Integration Platforms That Save Time
Enterprise integration shouldn't take months to deploy. Here's a strategic breakdown of 7 Celigo alternatives for 2026, with pricing, deployment timelines, and guidance on which platform fits your tech stack and team capabilities.

CRM System Examples: Real Workflows That Actually Make Sales Teams Work Together
Most sales teams lie in Monday meetings because their data is scattered across email, Slack, Trello, and someone's memory. CRM systems exist to fix this chaos, but only if you actually use them right. Here's what CRMs really do, with concrete workflow examples that show why they matter.

Trello Board Examples: 16 Ways to Organize Work, Life, and Everything Between
Trello's Kanban-style boards can organize basically anything with steps. From project management and sales pipelines to meal planning and wedding coordination, here are 16 board setups you can steal and customize for your own workflows.
Also Read

GitHub Cuts Secret Scanning False Positives by 94% With LLMs
GitHub has integrated large language models into its secret scanning workflow, reducing false positive alerts by 94% compared to traditional regex-based methods. The platform detected 39 million secret leaks in public repositories during 2024, and the new AI approach aims to eliminate the alert fatigue that made developers ignore warnings.

Summer Game Fest 2026: 10 Biggest Announcements and Trailers
Summer Game Fest 2026 ran for nine days and drew 3.8 million peak concurrent viewers. The showcase delivered major reveals including Alien: Isolation 2, a Tomb Raider remake, and Square Enix's simultaneous multi-platform release strategy for Final Fantasy VII.

Phantom Blade: Zero Moves Launch to October, Ignores GTA 6
S-Game's action RPG Phantom Blade: Zero will release October 29, 2026, just three weeks before GTA 6. Game director Qiwei Liang says the team focused entirely on polish rather than competitive timing.