Key Takeaways

- Kaggle datasets let you skip API setup and start analyzing Spotify data immediately
- Standard Python libraries like pandas, NumPy, and Seaborn handle music analytics well
- Jupyter notebooks make exploratory data analysis reproducible and shareable
What separates a Spotify hit from the millions of tracks that never break through? David Delony, a tech journalist at How-To Geek, decided to answer that question with data. He downloaded a dataset of over 30,000 Spotify songs and built a Python analysis to find patterns.
The project shows how accessible music data analysis has become. You don't need a Spotify developer account or API expertise. Kaggle hosts prebuilt datasets that anyone can download and explore.
Getting Started With Kaggle Data
Spotify makes data available to developers through its API. But scraping that data yourself takes time. Delony took a shortcut: he downloaded a dataset compiled by Joakim Arvidsson on Kaggle, a platform where data scientists share datasets and compete in machine learning challenges.
The download is a single command if you have the Kaggle CLI installed:
kaggle datasets download joebeachcapital/30000-spotify-songsFrom there, Delony set up a Jupyter notebook to document his analysis. He published the notebook on GitHub so others can follow along or extend the work.
The Python Stack for Music Analysis
The analysis uses a standard Python data science toolkit. Here's the import block that sets up the environment:
import numpy as np
import pandas as pd
import seaborn as sns
sns.set_theme()
%matplotlib inline
import matplotlib.pyplot as plt
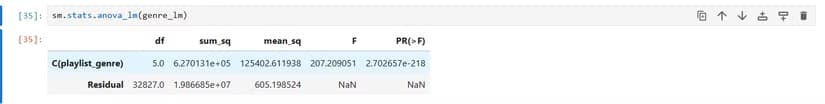
import statsmodels.formula.api as smf
import statsmodels.api as sm
from scipy import statsEach library handles a specific job. NumPy provides numerical analysis and linear algebra. pandas manages tabular data through DataFrames. Seaborn creates statistical visualizations. Statsmodels builds the regression models that test hypotheses about what makes songs popular.
Loading the data into pandas takes one line:
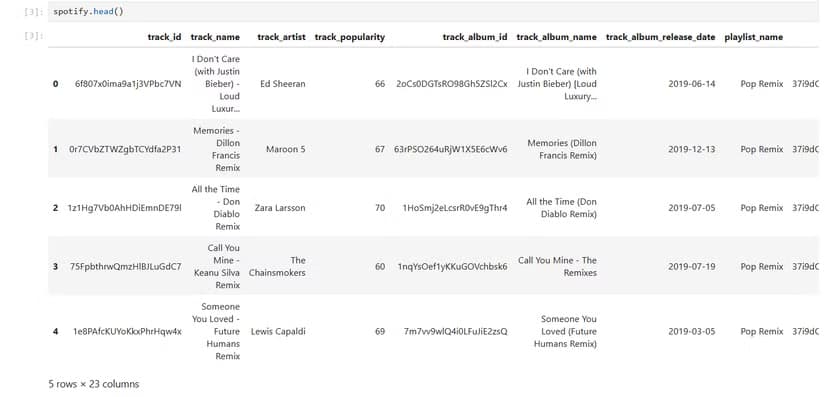
spotify = pd.read_csv('data/spotify_songs.csv')What the Dataset Contains
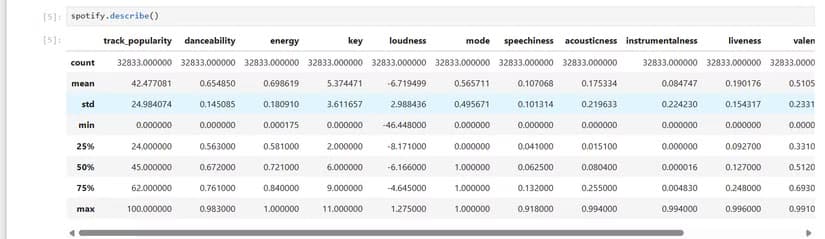
The Kaggle dataset includes a data card explaining each column. Some fields are identifiers like track_id. Others capture audio features that Spotify calculates for every track: danceability, energy, tempo, valence (musical positivity), and more.
These audio features give the analysis something concrete to measure. Instead of asking vague questions like "what makes a song catchy," you can test specific hypotheses. Do higher-energy songs get more streams? Does danceability correlate with playlist placement?
Visualizing the Data
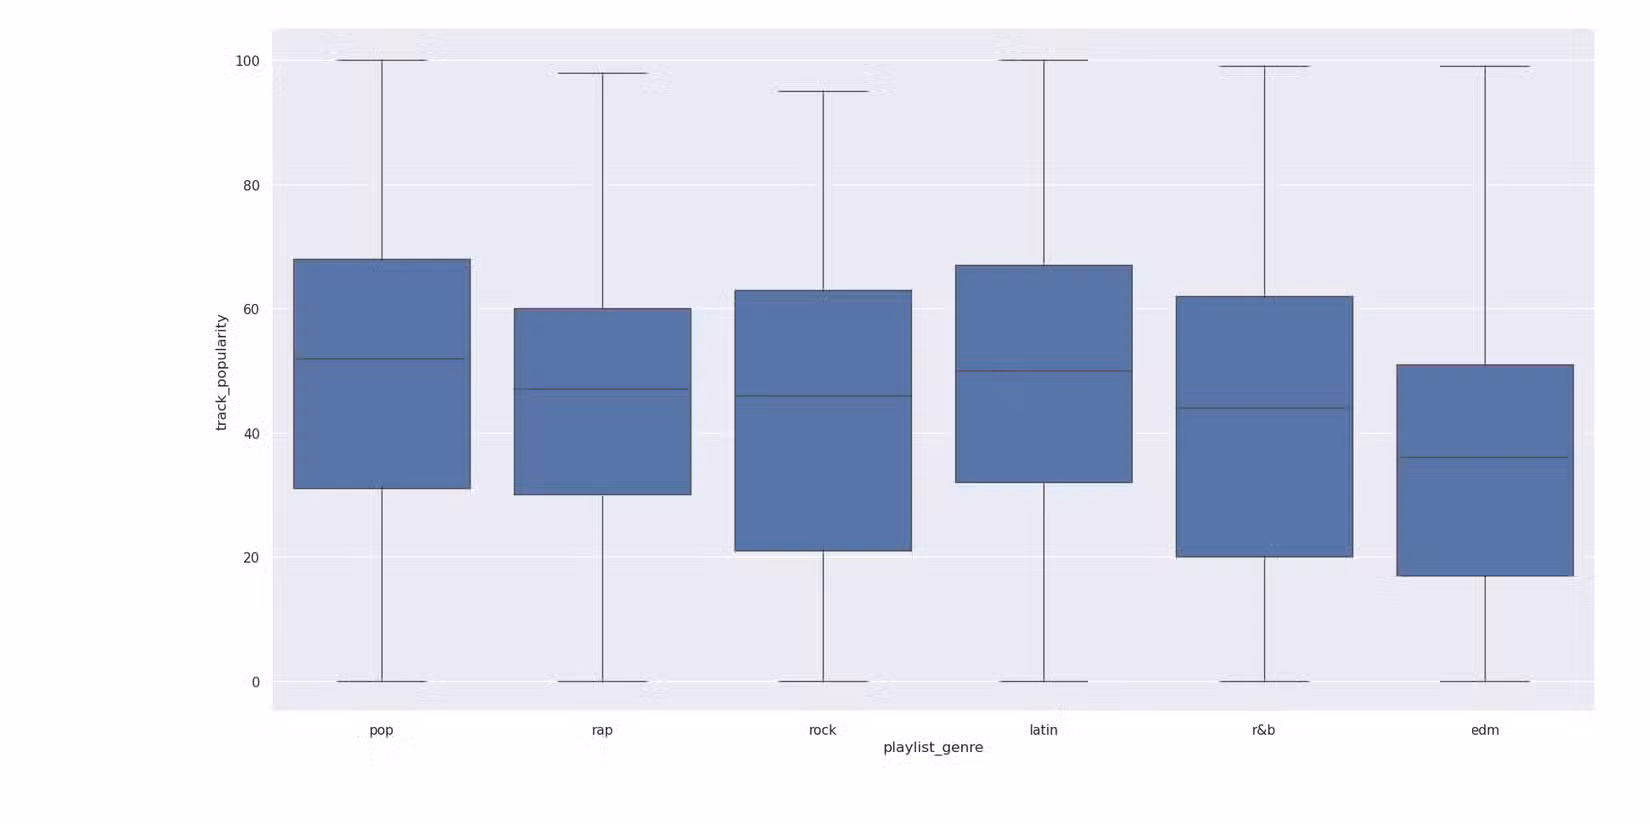
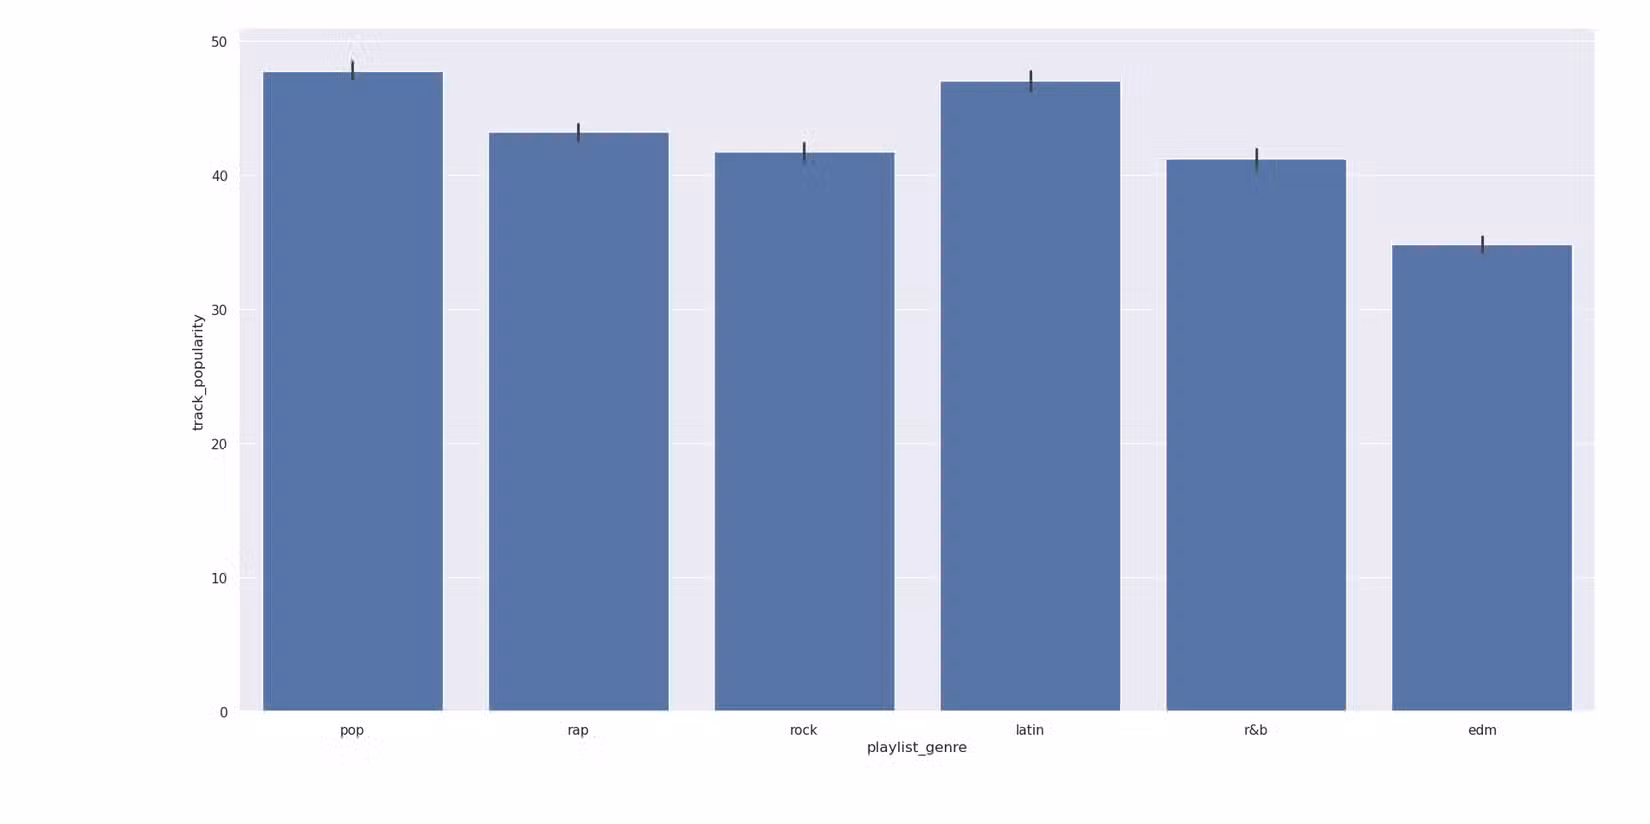
Delony used Seaborn's visualization tools to explore patterns. Histograms show the distribution of popularity scores. Box plots compare how different genres cluster around certain audio features.
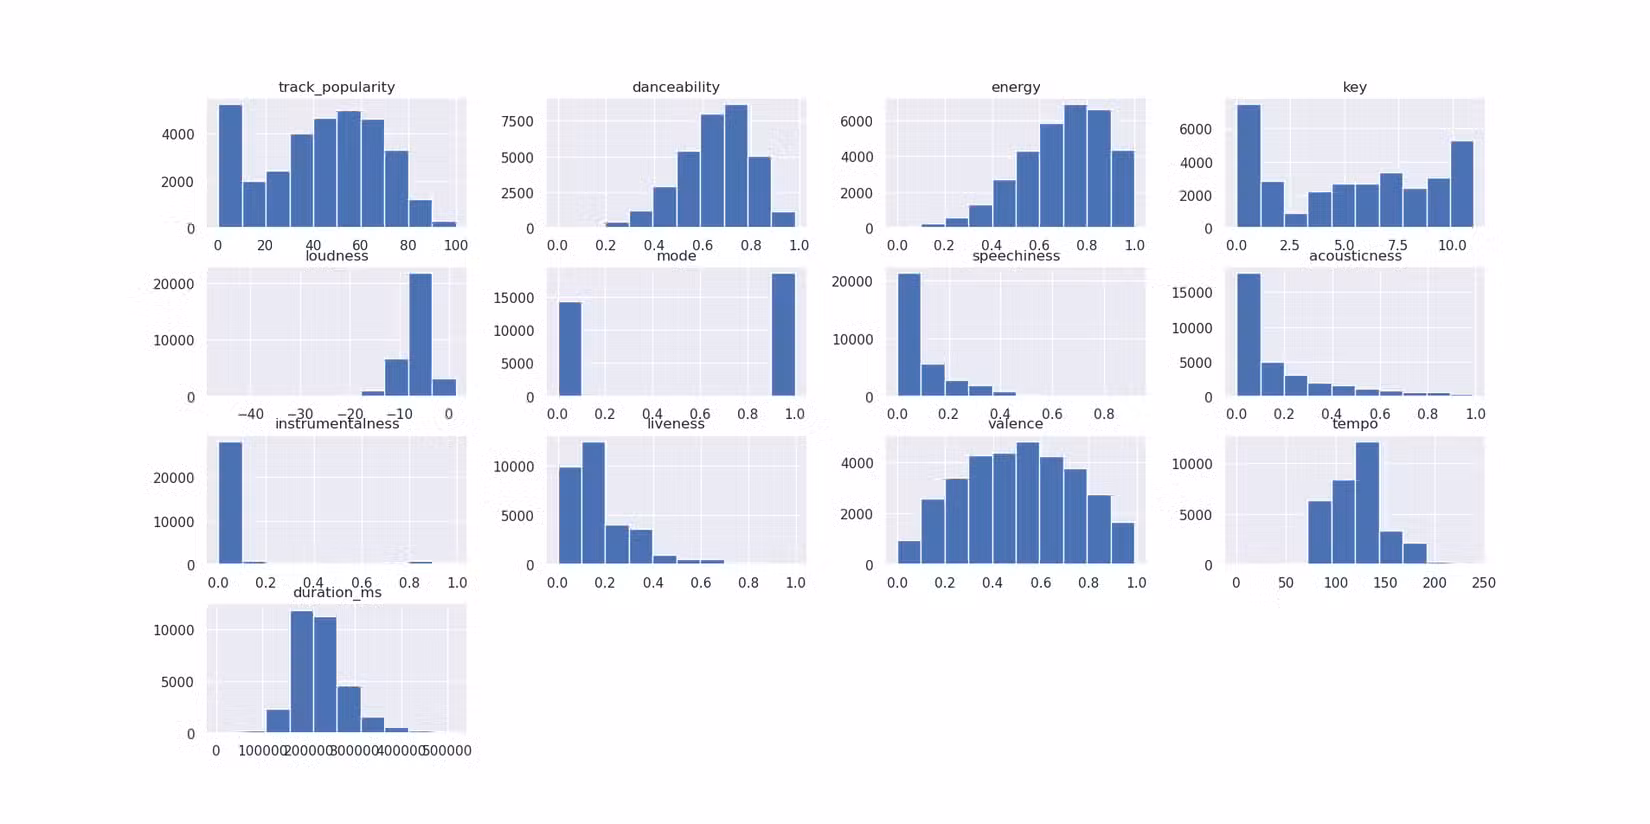
The visualizations reveal that popularity isn't evenly distributed. Most tracks cluster at lower popularity scores, with a long tail of genuine hits. This matches intuition: most songs don't break through, but the ones that do can reach massive audiences.
Why This Matters for Analysts and Hobbyists
The technical barrier to this kind of analysis has dropped significantly. A decade ago, you'd need database skills, API expertise, and serious statistical training. Now, a Kaggle dataset and a few Python libraries get you started in an afternoon.
For businesses, these same techniques apply to any domain with available data. Customer behavior, product performance, market trends. The tools are the same. The questions change.
Logicity's Take
Another practical guide to getting more from existing tools
Try It Yourself
Delony published his Jupyter notebook on GitHub. If you have Python installed, you can clone the repository and run the analysis on your own machine. Swap in a different dataset. Ask different questions. The framework transfers.
Frequently Asked Questions
Where can I download Spotify song data for analysis?
Kaggle hosts several Spotify datasets compiled by developers who used the Spotify API. You can download them with the Kaggle CLI or through the web interface.
What Python libraries do I need for music data analysis?
The core stack includes pandas for data manipulation, NumPy for numerical operations, Seaborn and Matplotlib for visualization, and statsmodels for statistical modeling.
Do I need a Spotify developer account to analyze music data?
Not if you use prebuilt datasets from Kaggle. You only need a developer account if you want to scrape fresh data directly from Spotify's API.
What audio features does Spotify track for each song?
Spotify calculates danceability, energy, tempo, valence (musical positivity), acousticness, instrumentalness, liveness, and speechiness for every track.
Need Help Implementing This?
Source: How-To Geek
Manaal Khan
Tech & Innovation Writer
Produced with AI assistance and reviewed by the Logicity editorial team. Learn more in our Editorial Policy.