Key Takeaways
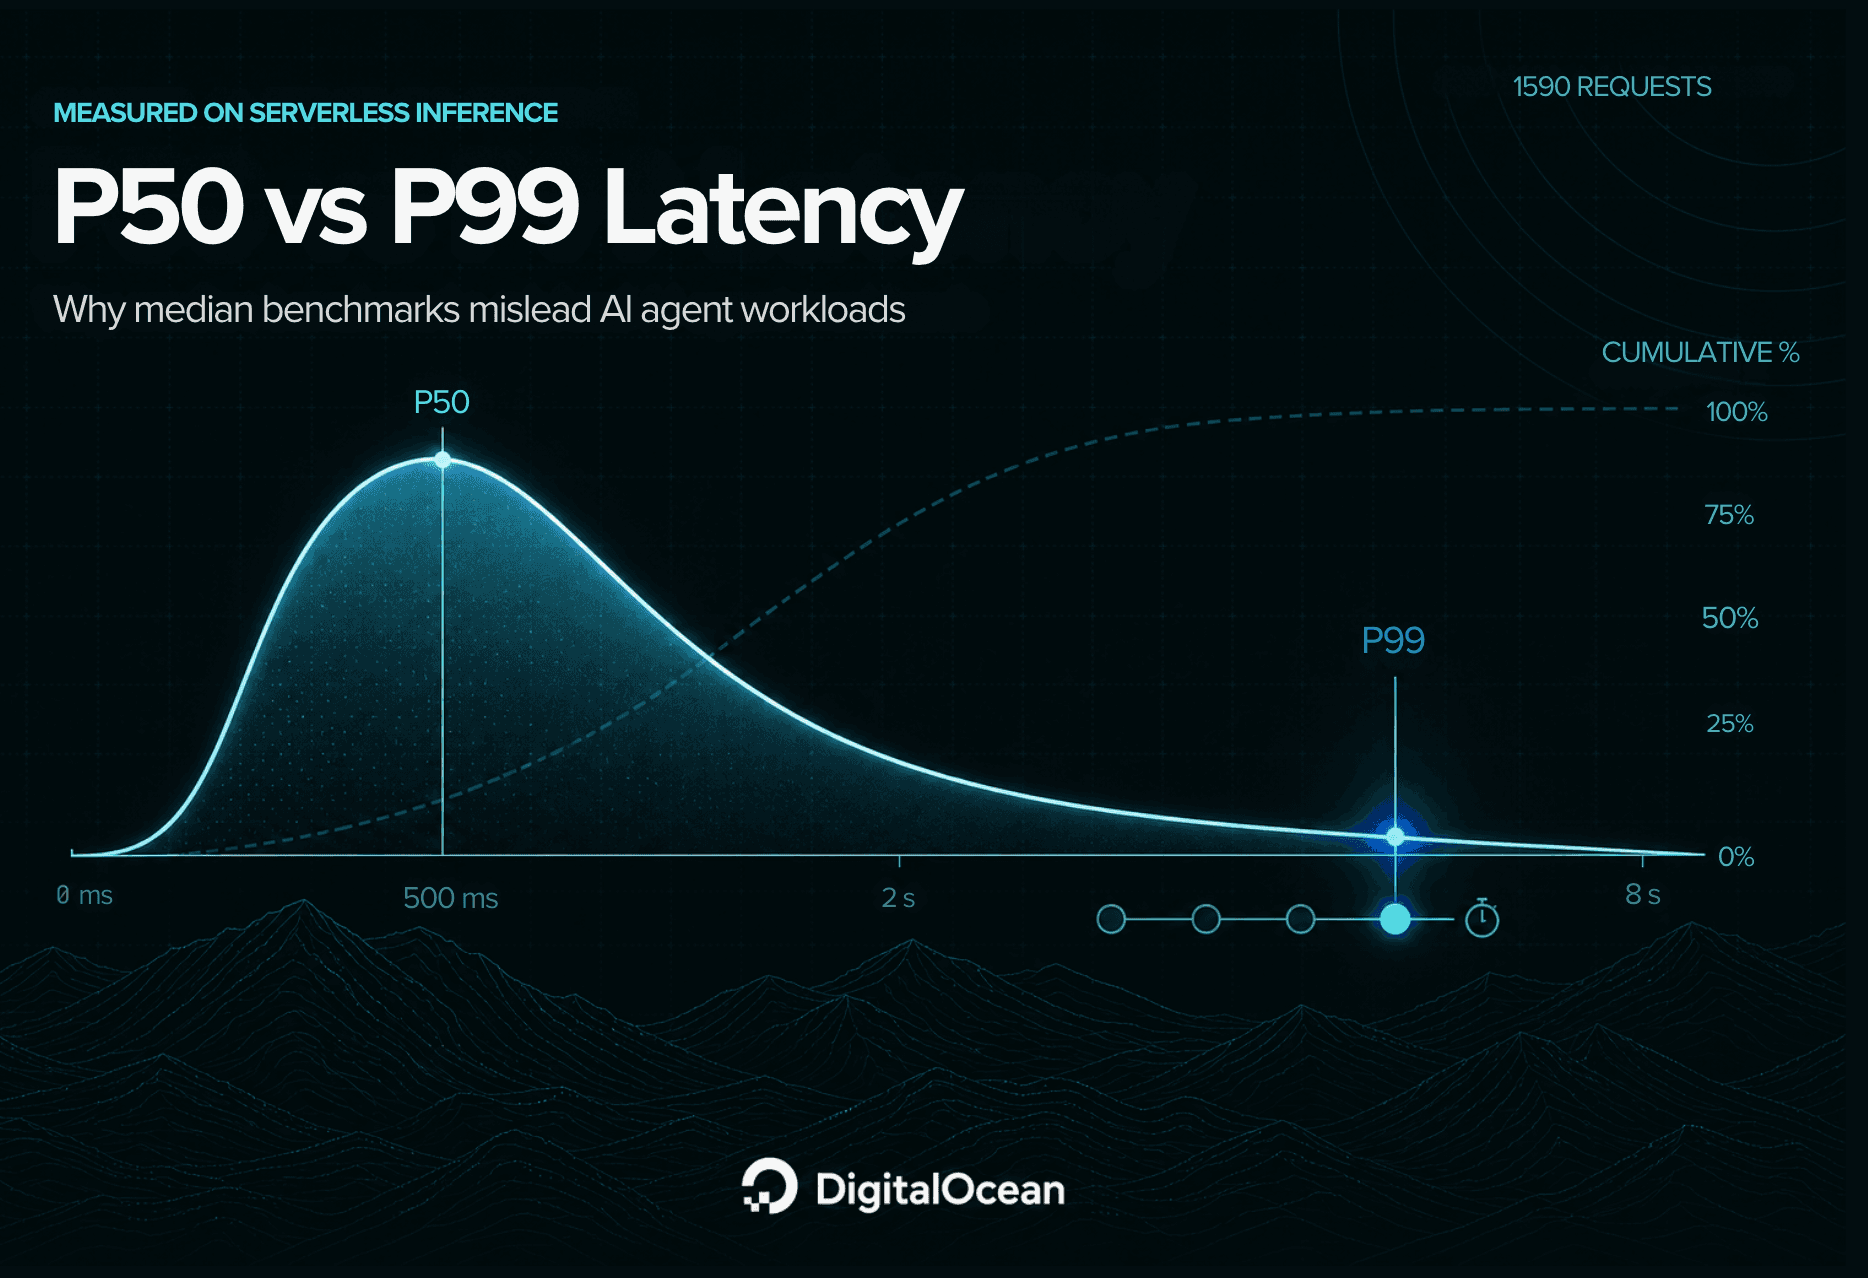
- A 20-call agent chain has an 18% chance of hitting at least one p99 tail event, even if each call only has 1% odds
- Time to first token, inter-token latency, and total completion time each matter for different workloads
- Published benchmarks often use low concurrency and warm instances, hiding real-world latency variance
Most inference benchmarks lead with a single number: median time to first token, or peak tokens per second. That number is accurate. It's also measured under conditions that flatter the provider, typically low concurrency, a warm instance, and a short prompt. The gap between those test conditions and your production traffic is where your latency surprises live.
Disclosure
Some links in this post are affiliate links — Logicity earns a commission if you sign up, at no extra cost to you. We only link products we have used or actively recommend.
For a single interactive request, the shape of the latency distribution matters more than its center. p95 and p99 describe what a real fraction of your users experience. The median describes the request nobody complains about. But for AI agents that chain multiple model calls to complete one task, the analysis changes entirely. Task completion time sums across calls, and the probability that at least one call lands in the tail grows with every additional call in the chain.
What p50, p95, and p99 actually measure
A percentile is a definition, not a measurement artifact. The p99 is the value that 1 percent of your traffic exceeds, by construction, every single day you run at that rate. If your median time to first token is 300 milliseconds but your p99 is 4 seconds, and you serve 10,000 requests daily, roughly 100 of those requests each day hit a wait more than ten times longer than the number on your dashboard.
That's not noise. That's 100 frustrated users per day, assuming each request maps to one user. For products where user sessions involve multiple requests, the exposure compounds.
| Metric | What it measures | When it matters most |
|---|---|---|
| p50 (median) | The latency half your requests beat | Internal dashboards, capacity planning |
| p95 | The latency 95% of requests beat | SLA definitions, user experience for most |
| p99 | The latency 99% of requests beat | Worst-case user experience, agent chains |
| p99.9 | The latency 99.9% of requests beat | High-traffic apps where 0.1% = thousands of users |
The divergence between p50 and p99 has concrete, mechanistic causes. Queueing under concurrency means your request's start time depends on how many other requests are ahead of it. Batching dynamics mean your request may wait for a batch window to fill before the GPU starts work. A long-prompt neighbor sharing your batch can delay your short request. These aren't bugs. They're architectural realities of shared inference infrastructure.
Why agent chains multiply tail latency risk
Here's where the analysis for AI agents diverges from single-request thinking. An agent completing a task might make 5, 10, or 20 sequential model calls: planning, tool use, retrieval, summarization, validation. Each call has an independent chance of landing in the latency tail.
The formula is straightforward. If each request has an independent probability q of hitting the tail, the probability that at least one request in a chain of n calls hits the tail is: P = 1 − (1 − q)^n
For a 20-call agent chain where each call has a 1% chance (p99) of landing in the tail:
P(at least one tail event) = 1 − (1 − 0.01)^20
P = 1 − 0.99^20
P = 1 − 0.818
P ≈ 18.2%
Close to one in five agent tasks of that length will contain at least one bad request, even though any single request only has a 1% chance of being slow. This is the mechanism the entire latency analysis for agents depends on: independent small risks, repeated enough times, stop being small.
For agent workloads, task completion time is the real metric, not per-call latency. A user doesn't care that 19 of your 20 calls were fast if the 20th took 8 seconds and the total task time blew past their patience threshold.
Relevant for teams building AI agent systems for enterprise workloads
TTFT, inter-token latency, and total time: pick the right metric
Latency isn't one number. It decomposes into components that matter differently depending on your use case.
Time to first token (TTFT) measures how long a user waits before seeing any response. For chat interfaces, this is the primary perceived latency. A 2-second TTFT feels like the system is thinking; a 200ms TTFT feels instant.
Inter-token latency measures the gap between tokens during streaming. Once output starts, users tolerate jitter less than they tolerate initial delay. Smooth streaming at 50 tokens per second feels better than bursts of 100 tokens with 500ms gaps.
Total completion time matters for batch workloads, background processing, and agent chains where the user isn't watching the output stream. If your agent is doing retrieval-augmented generation in the background, nobody sees the tokens stream. They see the final answer arrive.
Most published benchmarks optimize for TTFT because it makes the demo look good. But if your workload is agent-based, you need total completion time across the full chain, at p95 or p99, under realistic concurrency.
How to read a latency benchmark critically
Every benchmark is true under its test conditions. The question is whether those conditions match yours. Here's a checklist for reading any published benchmark critically:
- What concurrency level was used? A benchmark at 1 concurrent request tells you nothing about behavior at 50.
- Was the instance warm or cold? Cold starts add seconds that won't appear in warm-instance benchmarks.
- What prompt length was tested? A 100-token prompt and a 10,000-token prompt have different latency profiles.
- Which percentile is reported? If only p50 is shown, ask what the p99 looks like.
- Was the test run during peak or off-peak hours on shared infrastructure?
- How many samples were collected? 100 requests won't give you a stable p99 estimate.
Providers aren't lying when they publish flattering numbers. They're measuring under conditions they control. Your job is to measure under conditions that match your traffic.
A practical test protocol for your own workload
The only benchmark that matters is the one you run against your own traffic shape. DigitalOcean published a test protocol for their Serverless Inference product that's worth adapting to any provider. The principles transfer regardless of which infrastructure you use.
First, define your realistic concurrency. If your product has 100 daily active users making requests throughout the day, your average concurrency might be 2-5. If you have traffic spikes, test at spike levels.
Second, use production-representative prompts. Pull actual prompts from your logs, or synthesize prompts that match your distribution of lengths and complexity.
Third, collect enough samples to stabilize percentile estimates. For p99, you need at least 1,000 requests to get a reasonably stable estimate. For p99.9, you need 10,000+.
Fourth, measure across time. Run your test at different hours and days to capture variance from shared infrastructure load.
Fifth, compute task completion time for agent chains, not just per-call latency. Sum the latencies across a realistic call sequence.
Infrastructure choices matter here. Providers like DigitalOcean, Cloudflare, and Vercel offer different tradeoffs between cost, cold start behavior, and tail latency. Running your own test protocol against each gives you data that press-release benchmarks can't.
Covers infrastructure and AI companies receiving significant investment
The decision framework: when to optimize for which metric
Not every workload needs the same latency optimization. Here's a simple framework:
- Interactive chat with streaming: Optimize for p95 TTFT and inter-token latency. Users forgive slow total completion if they see tokens appearing quickly.
- Single-turn API calls: Optimize for p95 total completion time. There's no streaming to mask the wait.
- Agent chains (5+ sequential calls): Optimize for p99 per-call latency and measure task completion time. Tail events compound.
- Batch processing: Optimize for throughput at acceptable p50. Tail latency matters less when no user is waiting.
Most teams building AI agents need to shift their monitoring from per-call median to per-task p95. The user experience depends on the full chain, not the average link.
Logicity's Take
The shift from single-model apps to multi-call agent architectures fundamentally changes how we should evaluate inference infrastructure. A provider with mediocre p50 but tight p99 variance may outperform one with better median but fat tails, specifically for agent workloads. Engineering managers should require vendors to disclose p99 at realistic concurrency, and build internal dashboards that track task completion time distributions, not just per-call averages. Teams using orchestration platforms like [n8n](https://logicity.in/r/n8n) or [Make](https://logicity.in/r/make) for agent workflows should instrument end-to-end latency at the workflow level, not just the model call level.
What this analysis doesn't cover
This piece focuses on latency measurement and interpretation. It doesn't cover how to reduce tail latency, which involves architecture decisions like speculative decoding, request hedging, or switching providers. It also doesn't cover cost tradeoffs. Lower tail latency often means paying for dedicated capacity rather than shared serverless infrastructure.
The question of whether your users notice latency differences is also workload-specific. For some applications, a 500ms vs 2s total time is meaningless. For others, it's the difference between a product that feels magical and one that feels broken.
Frequently Asked Questions
What is p99 latency and why does it matter?
p99 latency is the response time that 99% of requests beat. It describes the worst experience that 1% of your users will have. For high-traffic applications, that 1% can mean thousands of frustrated users daily.
How does tail latency affect AI agent performance?
AI agents make multiple sequential model calls. The probability of hitting at least one slow call grows with each additional call. A 20-call chain has roughly 18% odds of hitting a p99 tail event, even when each individual call only has 1% odds.
Why are published inference benchmarks often misleading?
Published benchmarks typically use low concurrency, warm instances, and short prompts. These conditions minimize latency variance but don't reflect real production traffic patterns with variable load and prompt lengths.
Should I optimize for TTFT or total completion time?
It depends on your workload. Interactive chat apps should optimize for time to first token. Agent chains and batch workloads should optimize for total completion time at p95 or p99.
How many samples do I need to measure p99 accurately?
At least 1,000 requests for a reasonably stable p99 estimate. For p99.9, you need 10,000+ samples to avoid measurement noise.
The median is the request nobody complains about. The p99 is the request that generates support tickets. For agent workloads, optimizing for the wrong metric means building a product that demos well but frustrates users in production.
Need Help Implementing This?
Building a latency monitoring strategy for AI agents? We cover infrastructure decisions, observability patterns, and vendor evaluation frameworks in our technical deep-dives. Subscribe to Logicity's engineering newsletter for implementation guides.
Manaal Khan
Tech & Innovation Writer
Produced with AI assistance and reviewed by the Logicity editorial team. Learn more in our Editorial Policy.