5 Python Libraries That Outperform Excel for Data Analysis
Key Takeaways
- NumPy handles statistical calculations and array operations faster than manual Excel formulas
- Pandas DataFrames work like spreadsheets but scale past Excel's 1,048,576 row limit
- SciPy adds advanced statistical tests like t-tests that Excel doesn't include natively
Excel has 1,048,576 rows. That's it. Hit that limit and your spreadsheet stops accepting data. Python's Pandas library doesn't care if you have 10 million rows. It just keeps working.
This isn't about Excel being bad. It's great for quick formatting and ad-hoc lookups. But for serious data analysis, Python's ecosystem of libraries offers something spreadsheets can't: reproducibility, scalability, and advanced statistics without add-ons.
Here are five Python libraries that make the transition worth it.
NumPy: The Statistical Backbone
NumPy is where Python data analysis starts. It handles linear algebra and multidimensional arrays without forcing you to write nested loops. The library uses LAPACK under the hood, which means calculations run fast.
The built-in functions cover the basics: mean, median, standard deviation. Here's how you'd generate 50 random samples from a normal distribution and calculate statistics:
import numpy as np
rng = np.random.default_rng()
a = rng.standard_normal(50)

# Average
a.mean()

# Median
np.median(a)

# Sample standard deviation
np.std(a, ddof=1)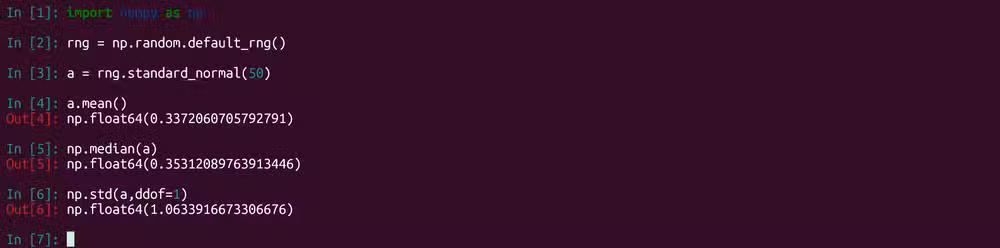
The ddof parameter reduces the sample size by one for standard deviation calculations. This matches the sample standard deviation formula you'd use in statistics courses.
Pandas: DataFrames That Scale
NumPy works with arrays and matrices. Pandas works with DataFrames, which are rectangular data structures that look like spreadsheets. The difference: Pandas can import SQL databases, Excel files, and CSVs directly.
Here's an example using a dataset of tips collected by a New York City waiter over a weekend:
import pandas as pd
tips = pd.read_csv('stats/data/tips.csv')
# View first few rows
tips.head()
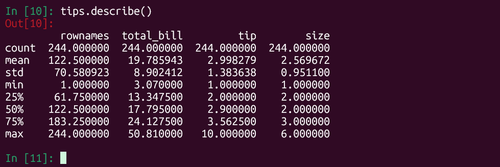
# Get descriptive stats for all columns
tips.describe()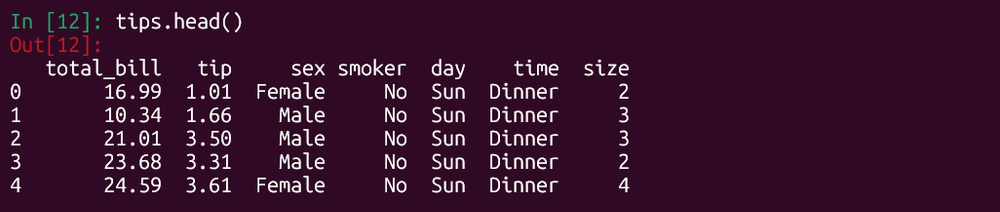
The describe() method gives you count, mean, standard deviation, min, max, and quartiles for every numeric column in one line. In Excel, you'd write separate formulas for each statistic, then copy them across columns.
SciPy: Advanced Statistical Tests
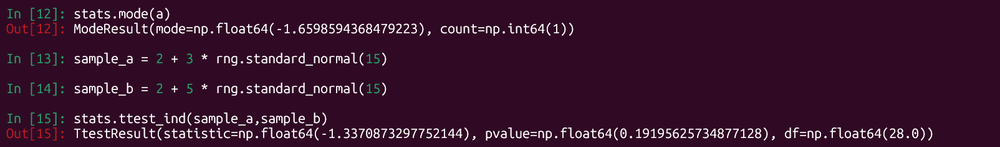
NumPy and Pandas cover descriptive statistics. SciPy goes further with inferential statistics. The stats submodule includes functions for t-tests, chi-square tests, and other hypothesis testing tools.
Notice that NumPy's descriptive stats don't include mode. SciPy fills that gap:
from scipy import stats
stats.mode(data_array)
For hypothesis testing, SciPy makes t-tests straightforward. Excel has a T.TEST function, but SciPy's implementation gives you more control over one-tailed vs two-tailed tests and equal vs unequal variance assumptions.
Why Python Beats Excel for Reproducibility
“The power of Python isn't just in what it can calculate, but in the reproducibility it brings to data workflows—something Excel simply cannot match.”
— Sarah Jenkins, Lead Data Architect at TechFlow Solutions
This is the real argument for Python over Excel. A Python script documents every step of your analysis. You can version control it with Git. A colleague can run the same script and get identical results.
Excel formulas are scattered across cells. They break when you copy them to different ranges. They don't explain why you made certain choices. Try auditing a complex Excel model six months after you built it.
The Learning Curve Trade-Off
Python requires learning syntax. That's the honest trade-off. You can't just click a cell and type a number. You need to understand imports, variable assignment, and method calls.
But the investment pays off quickly. Once you know pd.read_csv() and df.describe(), you can analyze any CSV file in seconds. Scaling from one dataset to a hundred requires minimal code changes.
“Moving from Excel to Python is the single biggest step a data analyst can take to increase their professional velocity.”
— Mark Thompson, Senior Analytics Instructor
When to Stick With Excel
Python isn't always the answer. Use Excel when you need to share a quick table with non-technical stakeholders. Use it for ad-hoc lookups where writing a script would take longer than clicking through cells. Use it when the dataset fits comfortably under that 1,048,576 row limit and you don't need to repeat the analysis.
The goal isn't to replace Excel entirely. It's to know when Python is the better tool.
Covers common Excel pitfalls that Python workflows avoid
More command-line tools for technical workflows
Logicity's Take
Frequently Asked Questions
Can Python handle larger datasets than Excel?
Yes. Excel caps at 1,048,576 rows per sheet. Python's Pandas library handles datasets limited only by your machine's RAM, often millions of rows.
How long does it take to learn Python for data analysis?
Basic proficiency with NumPy and Pandas takes 2-4 weeks of regular practice. You can start analyzing real datasets within days of learning the fundamentals.
Do I need to install anything to use Python for data analysis?
Yes. You'll need Python installed plus the libraries. The easiest route is installing Anaconda, which bundles Python with NumPy, Pandas, SciPy, and other data science tools.
Can Python read Excel files directly?
Yes. Pandas includes pd.read_excel() which imports Excel files as DataFrames. You can also export back to Excel with df.to_excel().
Is Python better than R for data analysis?
Both work well. Python is more general-purpose and has broader application beyond statistics. R has deeper statistical libraries. Many analysts learn both.
Need Help Implementing This?
Source: How-To Geek
Manaal Khan
Tech & Innovation Writer
Related Articles
Browse all
How to Jailbreak Your Kindle: Escape Amazon's Control Before They Brick Your E-Reader
Amazon is cutting off support for older Kindles starting May 2026, but you don't have to buy a new device. Jailbreaking your Kindle lets you install custom software like KOReader, read ePub files natively, and keep your e-reader alive for years to come.

X-Sense Smoke and CO Detectors at Home Depot: UL-Certified Alarms You Can Actually Trust
X-Sense just made their UL-certified smoke and carbon monoxide detectors available at Home Depot stores nationwide. The lineup includes wireless interconnected models that can link up to 24 units, 10-year sealed batteries, and smart features designed to cut down on those annoying false alarms that make people disable their detectors entirely.

How to Change Your Browser's DNS Settings for Faster, Private Browsing in 2026
Your browser's default DNS settings are probably slowing you down and leaking your browsing history to your ISP. Here's why changing this one setting should be the first thing you do on any new device, and how to pick the right DNS provider for your needs.
Raspberry Pi at 15: Why the King of Single-Board Computers Is Losing Its Crown
After 15 years of dominating the hobbyist computing scene, the Raspberry Pi faces serious competition from cheaper alternatives, supply chain headaches, and a market that's evolved past its original mission. Here's what's happening and what it means for your next project.
Also Read

2027 Subaru BRZ Keeps Manual Standard While Rivals Go Auto
Subaru announced pricing for the 2027 BRZ, starting at $36,140 with a six-speed manual transmission as standard equipment. In a market where most affordable sports cars have shifted to automatic as the default, the BRZ goes the opposite direction, making the automatic the upgrade option.

YouTube's Gemini Search Jumps to Exact Answers in Videos
YouTube's new 'Ask YouTube' feature uses Gemini AI to understand natural language questions and skip users directly to the relevant timestamp in a video. The feature is currently limited to Premium subscribers but will roll out to all users later this year.

Xbox Games Showcase 2026: Every Major Reveal and What's Coming
Microsoft's Xbox Games Showcase arrives amid the brand's 25th anniversary and a turbulent period of leadership changes. The event promises reveals for Gears of War E-Day, Halo: Campaign Evolved, and potentially State of Decay 3, as the company attempts to steady its gaming division after years of layoffs and studio closures.