3 Excel Projects to Try This Weekend for Personal Finance
Key Takeaways
- A reading log with drop-down menus and progress tracking takes under an hour to build
- Utility trackers with color-scale formatting help spot consumption spikes at a glance
- Budget dashboards using Excel tables auto-expand as you add new transactions
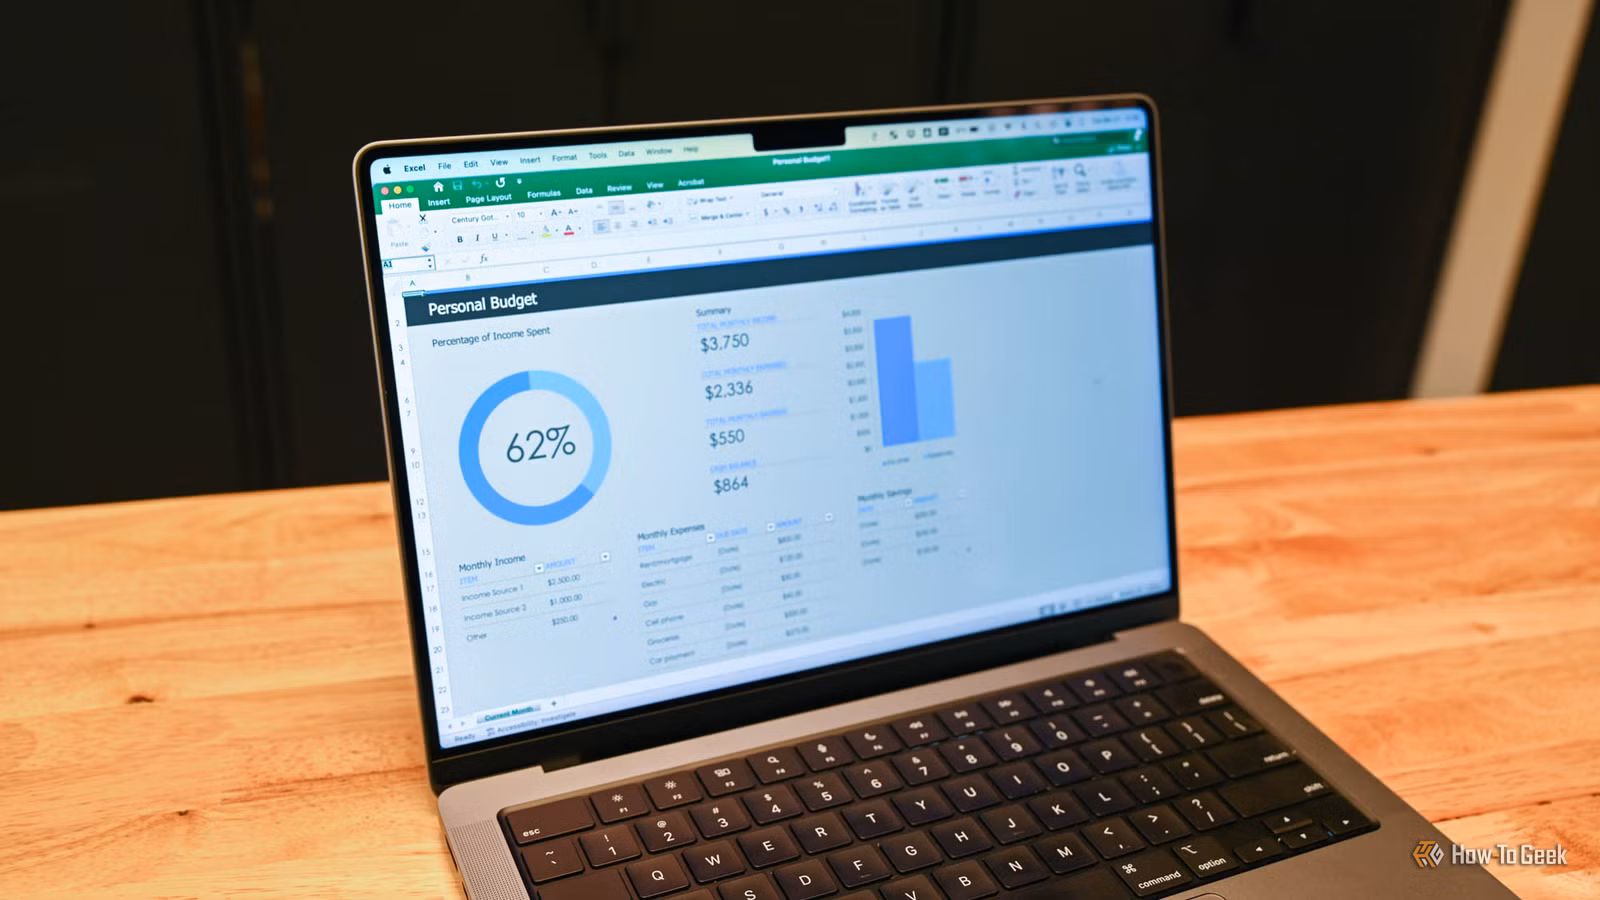
A quiet weekend is the perfect time to build something useful in Excel. Not a corporate report or quarterly forecast, but a personal tool that helps you track books, monitor utility bills, or manage your budget. Tony Phillips at How-To Geek has put together three guided projects that transform blank worksheets into practical organizers.
Each project relies on core Excel features: tables, data validation, conditional formatting, and a handful of formulas. No VBA required. No third-party add-ins. Just the standard tools that have made Excel the default choice for 1.3 billion users worldwide.
Project 1: Build a Personal Library Log
The first project is a reading tracker designed to motivate you to work through your book stack. The setup starts simple: create column headers for Title, Author, Genre, Format, Status, and Finished Date in row 5. Add your first book's details, then convert the range to a table using Ctrl+T.
Name the table something descriptive like Library_Log_2026. This matters because named tables make formulas easier to read and maintain.
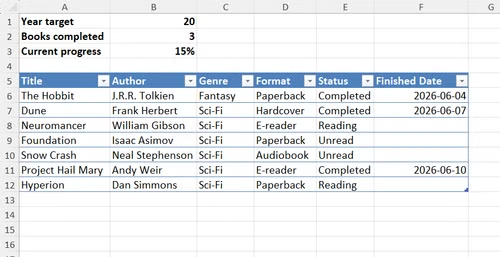
The real productivity boost comes from data validation. Select the Format column and create a drop-down list with options like Paperback, Hardcover, E-reader, and Audiobook. Do the same for Status with Unread, Reading, and Completed. These constraints keep your data clean and make filtering trivial.
Above the table, add an analytics card. Enter your yearly reading target in one cell, then use COUNTIF to count completed books and calculate your progress percentage. The table expands automatically as you add new entries.
Project 2: Create a Utility Consumption Tracker
The second project helps you monitor electricity, gas, or water usage over time. The structure mirrors the reading log: a table with columns for Date, Meter Reading, Consumption, Cost, and Consumption Change.
The key formula calculates the difference between consecutive readings. Once you have consumption data, apply color-scale conditional formatting to the Consumption Change column. Green highlights low usage periods. Red flags spikes. You can spot problems before the bill arrives.
Add a summary section above the table showing total consumption, average monthly cost, and year-over-year trends. The visual feedback makes it easier to connect behavior changes to actual savings.
Project 3: Design a Budget Dashboard
The third project is a budget tracker with a summary dashboard. Start with a table for transactions: Date, Category, Description, Amount, and Paid status. Use data validation for Category (Rent, Groceries, Utilities, Entertainment, etc.) and Paid (Yes/No).
The dashboard above the table uses SUMIF to total spending by category. Add a comparison column showing budget versus actual spending. Conditional formatting can highlight categories where you've exceeded your target.
Mark items as paid by updating the status column. A SUMIF formula can calculate remaining obligations. This simple system replaces subscription apps while keeping your financial data local and private.
Why Excel Still Dominates Personal Productivity
These projects work because Excel's core features have remained stable and reliable for decades. Tables auto-expand. Formulas update instantly. Data validation prevents input errors. You don't need to learn a new app or trust your data to a startup that might disappear.
“Excel has outlasted many tech trends, and in the age of AI, it remains very much in the mix... Rather than replacing spreadsheets with AI, Microsoft is adding tools that fit naturally into how people already use Excel.”
— TechRepublic Commentary
The 2026 version includes AI-powered features through Microsoft 365 Copilot, but the fundamentals haven't changed. You can build these projects on any version from the past decade. The skills transfer across versions and even to Google Sheets if needed.
Excel proficiency appears in 14.7% of LinkedIn job listings, making it the second most in-demand digital skill. Building personal projects is one of the best ways to develop that proficiency without the pressure of work deadlines.
Logicity's Take
Getting Started
Each project takes 30 to 60 minutes for a first-time builder. If you're comfortable with Excel tables and basic formulas, you can finish all three in an afternoon. The How-To Geek guide includes step-by-step screenshots for each formula and formatting rule.
The reading log is the easiest starting point. The budget tracker is the most immediately useful. The utility tracker pays off over months as you accumulate historical data. Pick the one that solves a problem you actually have.
Another productivity tool worth trying if you want to expand your personal organization system
Frequently Asked Questions
Do I need Microsoft 365 for these Excel projects?
No. These projects use features available in Excel 2016 and later, including the free online version of Excel. Tables, data validation, and conditional formatting work across all current versions.
Can I build these trackers in Google Sheets instead?
Yes. Google Sheets supports tables, data validation, and conditional formatting with slightly different menu locations. The formulas are identical.
How long does it take to build each project?
Expect 30 to 60 minutes per project if you're following the step-by-step guide. Experienced Excel users can finish each in 15 to 20 minutes.
Will my data be private if I use Excel?
Local Excel files stay on your device unless you save them to OneDrive or SharePoint. For maximum privacy, save to your local drive and skip cloud sync.
Need Help Implementing This?
Source: How-To Geek
Huma Shazia
Senior AI & Tech Writer
Related Articles
Browse all
How to Jailbreak Your Kindle: Escape Amazon's Control Before They Brick Your E-Reader
Amazon is cutting off support for older Kindles starting May 2026, but you don't have to buy a new device. Jailbreaking your Kindle lets you install custom software like KOReader, read ePub files natively, and keep your e-reader alive for years to come.
X-Sense Smoke and CO Detectors at Home Depot: UL-Certified Alarms You Can Actually Trust
X-Sense just made their UL-certified smoke and carbon monoxide detectors available at Home Depot stores nationwide. The lineup includes wireless interconnected models that can link up to 24 units, 10-year sealed batteries, and smart features designed to cut down on those annoying false alarms that make people disable their detectors entirely.
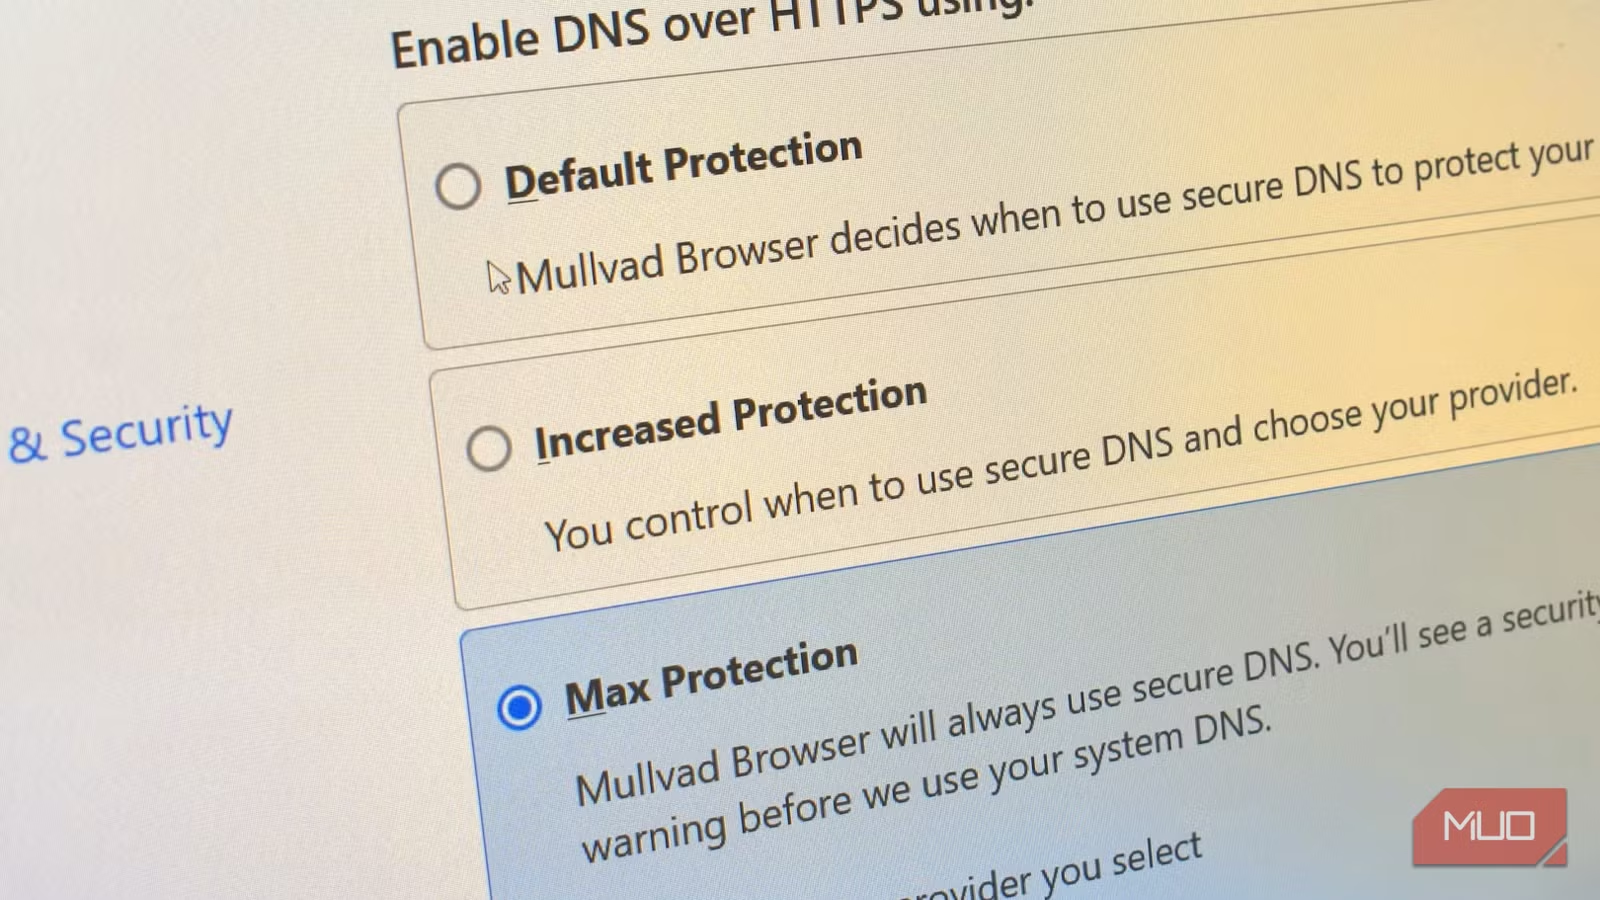
How to Change Your Browser's DNS Settings for Faster, Private Browsing in 2026
Your browser's default DNS settings are probably slowing you down and leaking your browsing history to your ISP. Here's why changing this one setting should be the first thing you do on any new device, and how to pick the right DNS provider for your needs.
Raspberry Pi at 15: Why the King of Single-Board Computers Is Losing Its Crown
After 15 years of dominating the hobbyist computing scene, the Raspberry Pi faces serious competition from cheaper alternatives, supply chain headaches, and a market that's evolved past its original mission. Here's what's happening and what it means for your next project.
Also Read

Quake Champions Gets Free Battle Pass for 30th Anniversary
id Software marks Quake's 30th birthday with a major update to Quake Champions. The free-to-play arena shooter receives a completely free battle pass, overhauled network code, and significant gameplay tweaks despite its small but dedicated player base.

Oracle PeopleSoft Zero-Day Exploited in 100+ Company Breaches
ShinyHunters hacking group has exploited a critical unpatched vulnerability in Oracle's PeopleSoft HR software, compromising over 100 organizations. Two-thirds of victims are universities, with student records already appearing on data leak sites. Oracle has issued mitigations but no patch exists yet.

SpaceX Launches 24 Starlink Satellites Hours Before Historic IPO
SpaceX sent 24 Starlink satellites into orbit from Vandenberg Space Force Base on June 11, pushing the constellation past 10,600 satellites. The launch came just one day before the company's anticipated NASDAQ debut at a $1.78 trillion valuation.