Key Takeaways
- sqltoerdiagram.com processes CREATE TABLE statements locally, with zero data leaving your browser
- The tool hit 340+ points on Hacker News within 24 hours, with developers praising its minimal codebase
- Features include drag-and-drop table positioning, zoom controls, and direct export options
A new SQL to ER diagram tool, sqltoerdiagram.com, lets developers paste CREATE TABLE statements and instantly see their schema visualized. The entire process runs in your browser. Nothing gets uploaded to a server, no account is required, and your schema data stays on your machine.
The tool surfaced on Hacker News this week and collected 340+ points in its first 24 hours, with 73+ comments offering feature requests and technical discussion. For database engineers tired of complex diagramming platforms that demand logins and cloud storage, this is the appeal: paste SQL, see the diagram, export it, move on.
How does the SQL to ER diagram tool work?
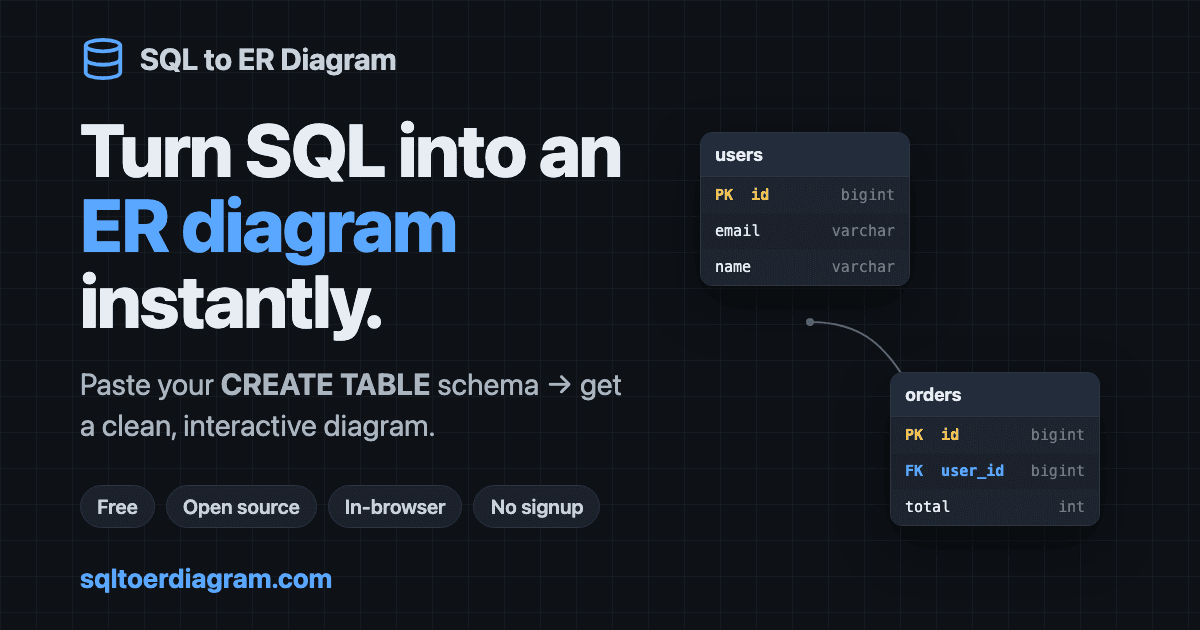
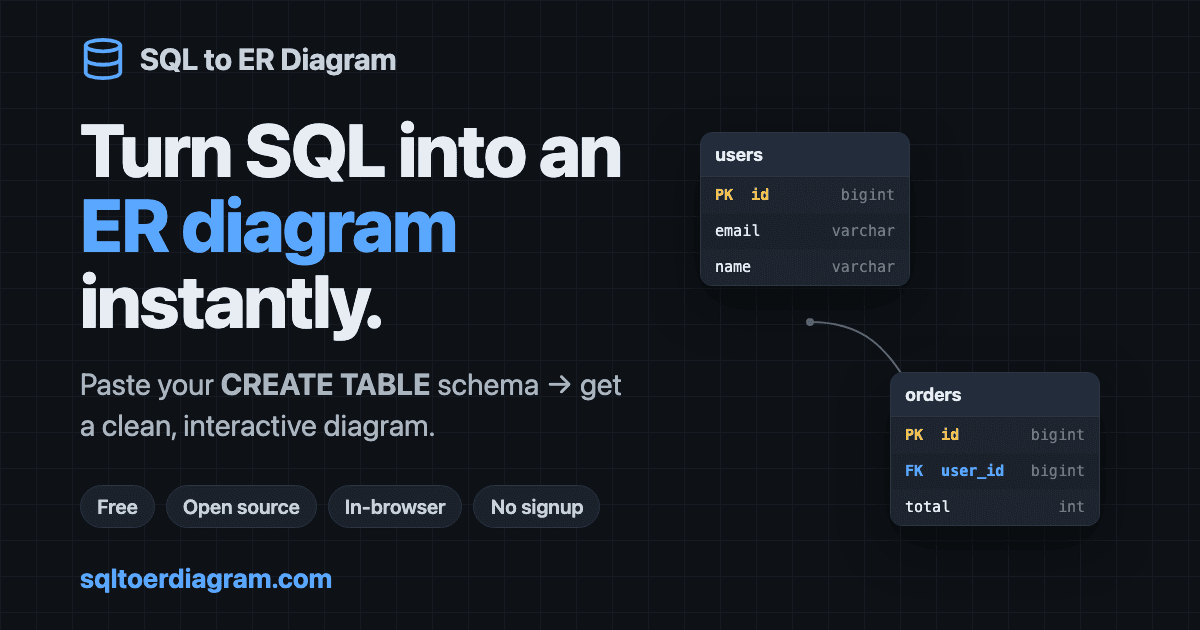
The workflow is deliberately minimal. You drop your CREATE TABLE statements into the left panel. The tool parses them client-side and renders an interactive diagram on the right. Tables appear as draggable boxes showing columns, data types, and relationships inferred from foreign key constraints.
Scroll to zoom. Double-click a table name to rename it in the visualization. When the layout looks right, export. That's the entire feature set, and the community seems to prefer it that way.
“The codebase is a breath of fresh air; simple, effective, and no heavy frameworks required to solve a complex problem.”
— Anonymous Developer, Hacker News Discussion
The praise centers on what the tool does not do. It does not require a database connection. It does not store your schema in someone else's cloud. It does not ask you to create yet another SaaS account. For quick documentation tasks or schema reviews during code reviews, this approach removes friction.
Why does browser-only processing matter for schema tools?
Database schemas are sensitive. They reveal table structures, column names, relationships, and often hint at business logic. Uploading them to third-party services creates exposure, even if the service has strong security.
By processing everything in JavaScript on the client side, sqltoerdiagram.com sidesteps this concern entirely. The schema never leaves the browser tab. This makes it suitable for internal tools, proprietary systems, or any situation where data governance policies restrict external sharing.
The tradeoff is capability. A server-backed tool could offer AI-powered suggestions, collaboration features, or database introspection. This tool does none of that. It converts SQL to a diagram. If that's what you need, it does the job.
What did the developer community say?
Reaction on Hacker News leaned positive. Developers noted the clean mobile interface, an unexpected bonus for a utility tool. Several commenters requested support for additional SQL dialects and export formats.
One thread debated whether the output constitutes a true ER diagram or a relational model diagram. The distinction matters to database theorists: ER diagrams represent entities and relationships at a conceptual level, while relational model diagrams show actual tables and columns. The tool produces the latter, but the semantic argument did not dampen enthusiasm.
Others compared it to established tools like dbdiagram.io, DBeaver's built-in visualizer, and pgAdmin. The consensus: those tools offer more features, but also more overhead. For a quick paste-and-visualize workflow, the new entrant holds its own.
Where does this fit in a developer's toolkit?
Schema visualization has a few common use cases. During code reviews, seeing a diagram helps reviewers understand migration files. During onboarding, new engineers grasp a codebase faster with a visual map. During debugging, a quick diagram can reveal missing indexes or relationship errors.
For any of these tasks, the traditional path involves opening a heavier tool, connecting to the database, or importing schema files into a diagramming app. sqltoerdiagram.com shortcuts this. Copy the relevant CREATE statements from your migration folder, paste, screenshot, done.
The tool will not replace a dedicated data modeling platform for complex projects. It is not designed to. But as a utility for quick visualizations, it earns a spot in the browser bookmarks.
Another free tool removing barriers to useful functionality
Frequently asked questions
Frequently Asked Questions
Does sqltoerdiagram.com upload my schema to a server?
No. All processing happens in your browser. The schema data never leaves your machine.
What SQL dialects does the tool support?
The tool parses standard CREATE TABLE statements. Support for specific dialect extensions may vary, and users have requested broader compatibility in community feedback.
Can I export the diagram?
Yes. The tool includes an export function after you have positioned tables and finalized the layout.
Is this an ER diagram or a relational model diagram?
Technically, it produces a relational model diagram showing tables and columns, rather than a conceptual ER diagram. The practical difference matters mainly in academic contexts.
Is the tool open source?
Community comments reference examining the codebase, suggesting the source is accessible, though the exact licensing was not specified in available discussions.
Logicity's Take
The success of sqltoerdiagram.com reflects broader frustration with tooling bloat. Developers increasingly want single-purpose utilities that do one thing well, run locally, and respect privacy. The 340+ Hacker News points in 24 hours signal demand for this approach. If the creator adds support for more SQL dialects and additional export formats, this could become a standard utility in the same category as JSON formatters and regex testers.
Need Help Implementing This?
If your team is evaluating database visualization tools or needs help with schema documentation workflows, Logicity covers the tools and practices that matter. Subscribe to our newsletter for weekly updates on developer utilities, infrastructure trends, and practical engineering insights.
Source: Hacker News: Best
Manaal Khan
Tech & Innovation Writer
Produced with AI assistance and reviewed by the Logicity editorial team. Learn more in our Editorial Policy.