Key Takeaways
- iotop shows real-time disk read/write activity per process when top fails to explain slowdowns
- There are two variants: Python-based iotop and the faster iotop-c written in C
- Focus on DISK READ, DISK WRITE, IO%, and COMMAND columns for quick diagnosis
- Requires root privileges to run, but installation takes seconds on any major distro
Read in Short
When your Linux system slows down but CPU and RAM look fine, disk I/O is often the hidden culprit. The iotop command shows you exactly which process is reading or writing to your disk in real time. It's a game-changer for troubleshooting.
Here's a scenario that drives me absolutely crazy. My Linux box starts lagging. Everything feels sluggish. So I fire up top like any reasonable person would, and... nothing. CPU usage is chill. Memory looks fine. What gives?
Turns out I was looking in the wrong place entirely. The bottleneck wasn't the processor or RAM. It was my disk getting absolutely hammered by some process I couldn't see with traditional monitoring tools.
Enter iotop. This command has genuinely changed how I troubleshoot performance issues, and I'm kicking myself for not discovering it sooner.
What iotop Actually Does
Think of iotop as the top command's disk-obsessed cousin. Instead of showing you CPU and memory hogs, it displays real-time disk I/O activity broken down by process. You can see exactly which application is reading from or writing to your storage, measured in bytes per second.
The thing is, disk I/O bottlenecks are sneaky. Your CPU might be sitting at 5% utilization while some background process quietly writes gigabytes to disk, causing everything else to wait in line. Traditional monitoring tools don't make this obvious.
Installing iotop Takes About 10 Seconds
Getting this tool onto your system is dead simple. The exact command depends on your distro, but you're looking at a one-liner either way.
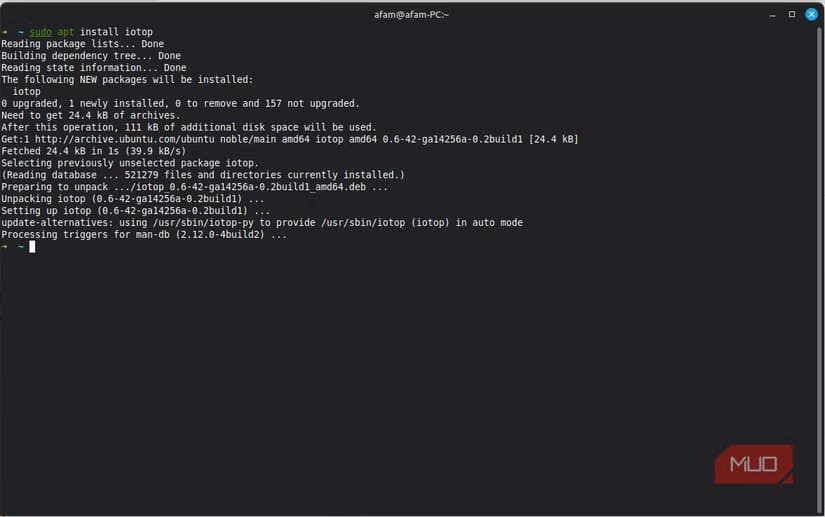
For Ubuntu, Debian, Linux Mint:
sudo apt install iotopFor Fedora:
sudo dnf install iotopFor Arch Linux:
sudo pacman -S iotopiotop vs iotop-c: Which One Did You Get?
There are actually two versions floating around. The original iotop is Python-based, while iotop-c is a newer rewrite in C. On modern Ubuntu and Debian systems, installing 'iotop' often gives you iotop-c automatically. The C version is snappier and uses fewer resources. Both work identically from a user perspective, so don't stress about which one you ended up with.
Running iotop and Making Sense of the Output
Fire it up with sudo privileges. You need root access because reading I/O stats for all processes requires elevated permissions.
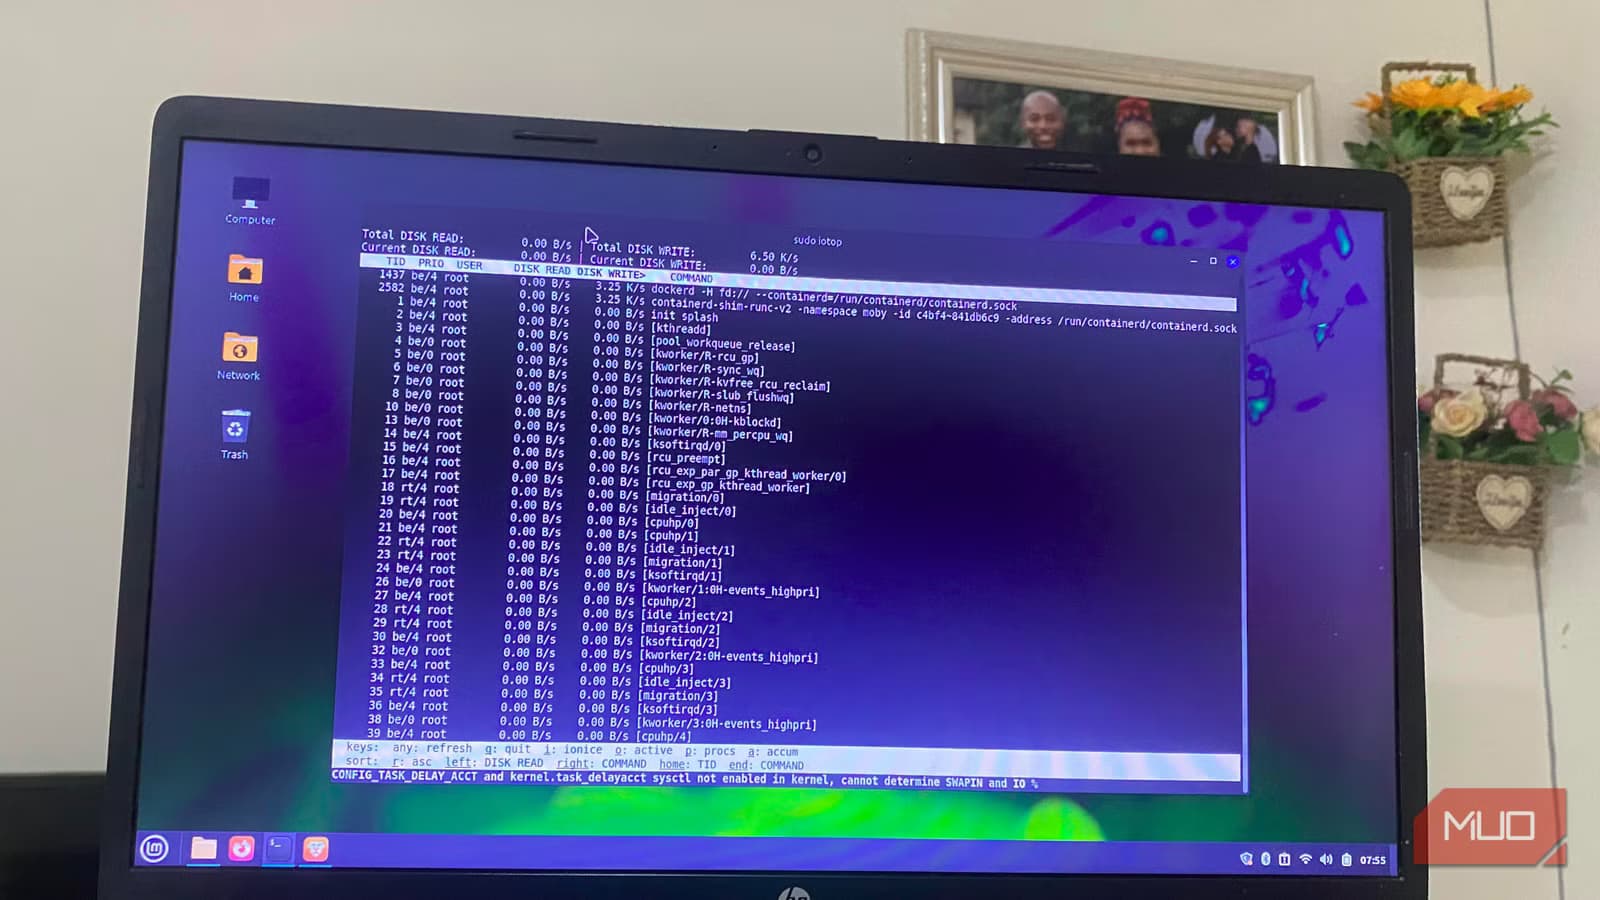
sudo iotopYou'll see a screen that looks kinda overwhelming at first. There's a summary section at the top and a process list below. Here's the thing though: you can ignore most of it.
The Four Columns That Actually Matter
- DISK READ: Bytes being read per second. High numbers here mean something's pulling data from storage.
- DISK WRITE: Bytes being written per second. Database processes, logging, and file copies show up here.
- IO%: The percentage of time a process spent waiting on I/O operations. This is your smoking gun for identifying bottlenecks.
- COMMAND: The actual process name. Finally, the culprit revealed.
I pretty much ignore the top summary section entirely. Seeing total disk activity is nice and all, but it doesn't help me find the specific process causing problems. Jump straight to the per-process list.
Practical Example: Catching a Runaway Backup
Last week my laptop felt like it was wading through molasses. Top showed nothing suspicious. But iotop? It immediately revealed that my backup software had decided to run a full system backup in the middle of my workday, writing over 50MB/s continuously.
That's the kind of insight you just can't get from traditional tools. The CPU wasn't stressed because the backup process was mostly waiting on disk operations, not doing heavy computation.
Useful iotop Flags to Know
The basic command works fine, but a few flags make life easier.
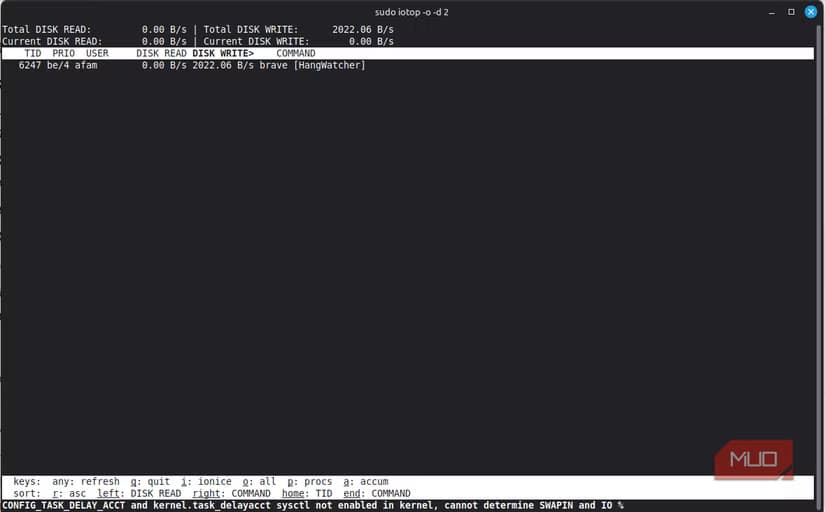
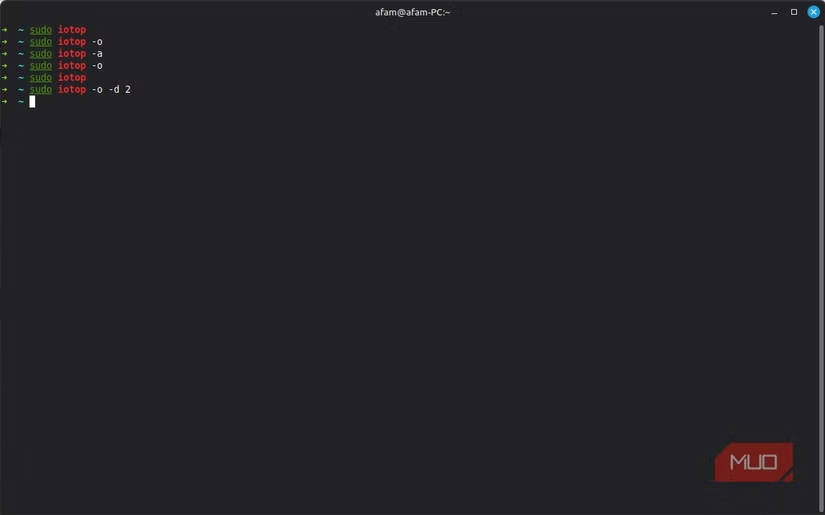
sudo iotop -oThe -o flag shows only processes currently doing I/O. This cuts through the noise dramatically. Instead of seeing every process on your system, you only see the ones actively reading or writing.
sudo iotop -aThe -a flag shows accumulated I/O instead of per-second rates. Useful for catching processes that do bursts of activity rather than sustained reads/writes.
sudo iotop -PThe -P flag shows processes instead of threads. Sometimes a single application spawns multiple threads doing I/O, and this consolidates them.
If you're optimizing your Linux workflow, you might also want to explore AI tools that can automate repetitive tasks and boost your overall productivity.
When to Reach for iotop vs Other Tools
So when should you actually use this? My mental checklist goes something like this.
- System feels slow but top shows low CPU and memory usage. This is the classic sign of I/O bottlenecks.
- You hear your hard drive churning constantly. SSDs are silent, but if you're on spinning rust, this is a dead giveaway.
- Applications take forever to launch even though your system isn't 'busy' by traditional metrics.
- You suspect a background process is doing something sketchy with your disk.
For CPU-bound issues, stick with top or htop. For memory problems, free and vmstat are your friends. But for disk I/O? iotop is the answer.
A Word About SSDs vs HDDs
Disk I/O issues hit different depending on your storage type. On traditional spinning hard drives, I/O bottlenecks are brutal because the drive can only physically move so fast. SSDs handle random reads and writes way better, but they're not immune to saturation.
I've seen NVMe drives get hammered so hard by aggressive processes that the system became unresponsive. Fast storage isn't a magic bullet. If something's writing hundreds of megabytes per second, you're gonna feel it.
My New Troubleshooting Workflow
iotop has permanently changed how I diagnose slow Linux systems. My new approach looks like this:
- Run top to check CPU and memory. If something's pegged at 100%, there's your problem.
- If top looks clean but the system is slow, immediately run sudo iotop -o.
- Identify any process with high DISK WRITE, DISK READ, or IO%.
- Decide whether to kill the process, lower its priority with ionice, or just wait it out.
It's such a simple addition to the toolkit, but it fills a gap I didn't even realize existed. Performance troubleshooting on Linux just got a whole lot easier.
Pro Tip: Combine with ionice
Found the culprit but don't want to kill it? Use ionice to lower a process's I/O priority. Run 'ionice -c 3 -p [PID]' to set it to idle class, meaning it only gets disk access when nothing else needs it.
Bottom Line
If you've been troubleshooting Linux performance issues without iotop in your arsenal, you've been flying blind. This tool takes five seconds to install and instantly reveals a dimension of system activity that top completely misses.
Next time your Linux box feels sluggish and the usual suspects check out clean, give iotop a shot. Chances are something's quietly thrashing your disk, and now you'll know exactly what it is.
Sources & Credits
Originally reported by MakeUseOf
Huma Shazia
Senior AI & Tech Writer
Produced with AI assistance and reviewed by the Logicity editorial team. Learn more in our Editorial Policy.